
Advertisement
Advertisement
US Oil Production Is Slowing, The Ramifications Will Be Significant
By:
Key Points:
- US oil production is finally showing signs of peaking.
- Since early 2023, almost all production growth has resulted solely from productivity gains. The rig count, frac spreads, Drilled But Uncompleted Well count and Completed Well count are now all in decline. What’s more, the EIA’s reported production numbers were likely overstated in 2023.
- Expect shale to continue to grow marginally in the short-term, but average growth is likely to surprise to the downside from here. Productivity gains will eventually catch up to geology.
- US shale production should peak sometime in 2025/2026 and plateau from there. Given the lack of capex spending, production growth outside of price spikes will be difficult to sustain.
- The ramifications will be significant. The only source of non-OPEC+ supply growth in the past 15 years will disappear. The burden will then fall on Canada, Brazil and Guyana as well as OPEC+ to fill that gap, a difficult task over the medium-term.

In this article:
US Oil Production Growth Is Slowing
The story of peak shale oil production in the US has been espoused by energy bulls for years. After endless calls for shale production to peak, it appears we may finally be approaching that nexus. The slowdown in US oil production is looking very real.
Even with the rebound in oil production following the COVID lockdowns, annual production growth in the US is currently sitting at around 0.5 mm b/d. This is firmly below the ~1 mm b/d average growth we saw in 2022 and 2023, and significantly below the peak growth years of 2018 and 2019.
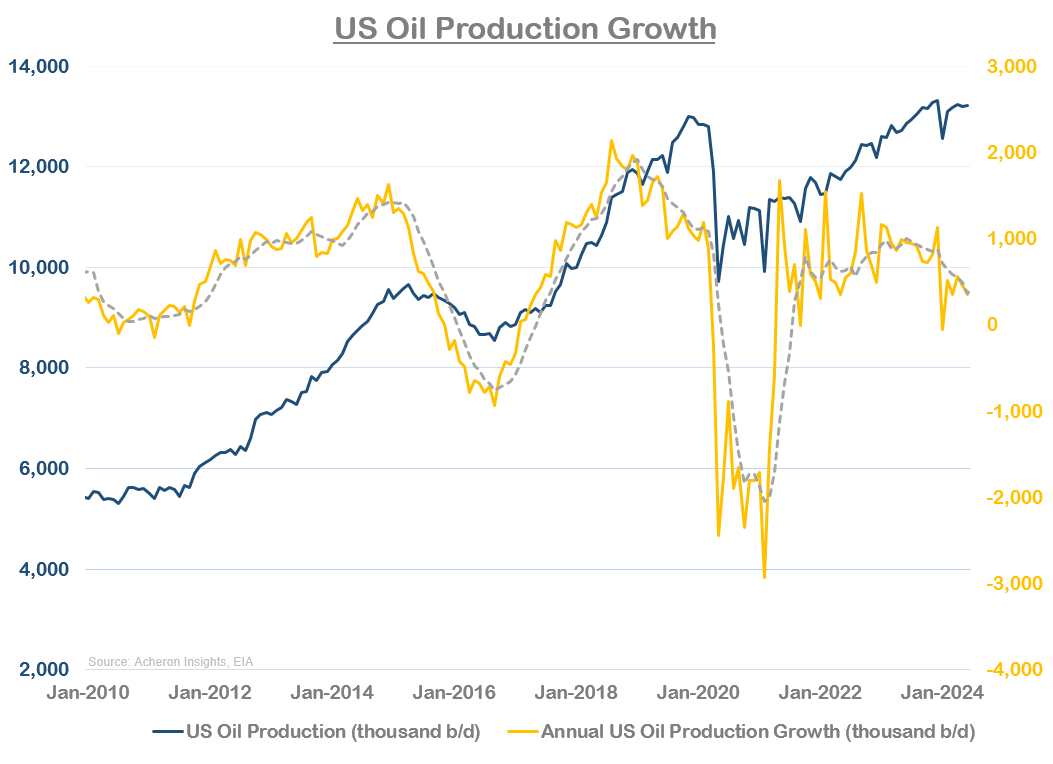
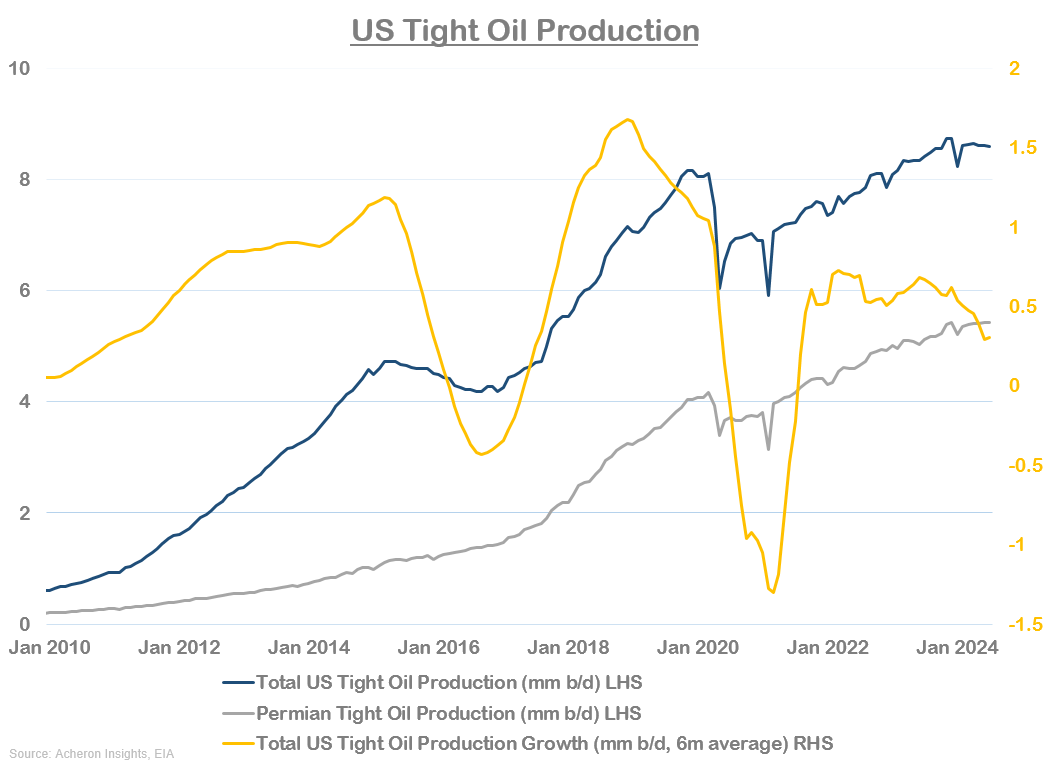
Importantly, the steady decline in overall oil production growth is primarily being driven by a decline in tight oil production from the shales. US shale production has been the only major source of non-OPEC supply growth over the past 15 years.
As it stands, according to the EIA’s oil production data, total tight production is currently ~8.60 mm b/d, down 160,000 b/d from the November peak of 8.74 mm b/d. Meanwhile, Permian tight oil production is currently around ~5.42 mm b/d, which itself is 100,000 b/d below December’s peak of 5.43 mm b/d.
While the stalling growth in headline production figures are clear, when we adjust these figures to account for the EIA’s Adjustment Factor we get an even more startling picture. The Adjustment Factor in the EIA’s reporting reconciles the supply and demand imbalance that arises from the fact that some of their reported data is estimated. Of the reported EIA data, the stockpile figures are their most accurate, given they are derived directly from producer surveys. Other figures that are fairly accurate include refinery throughput, imports/exports and transfers to crude oil.
On the other hand, demand measures in addition to actual production figures are closer to estimates than confirmed data, thus, the Adjustment Factor is the plug that ensures their reported inventory changes match the difference between reported supply and reported demand.
A positive adjustment figure tends to suggest supply exceeds demand (and thus production is being understated), and a negative adjustment figure suggests production is being understated. By adding the adjustment figure to the EIA’s reported production numbers, this then provides a more accurate picture of actual US oil production.
As we can see below, prior to 2023, the adjustment figure was persistently positive, and as a result reported oil production was seemingly lower than actual oil production. But, since the EIA introduced the “transfer to crude oil supply” data point in 2023 to attempt to fix the large adjustment errors by capturing any overstating of demand that resulted from NGL’s being blended with crude oil and effectively being double counted as demand, the adjustment figure has become persistently negative, meaning US oil production was likely overstated during much of 2023.
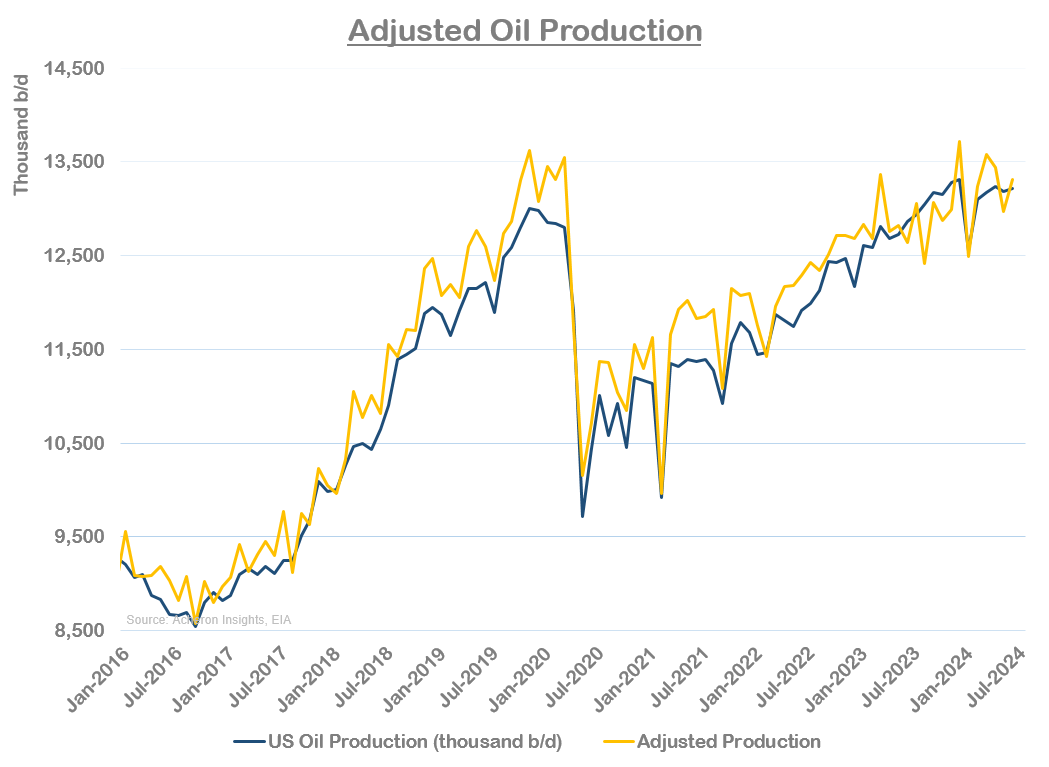
By using this adjusted oil production methodology, we can see that oil production in Q4 2022 averaged around 12.71 mm b/d, as opposed to the reported 12.36 mm b/d. Conversely, in Q4 2023, actual oil production was closer to 13.20 mm b/d, rather than the reported 13.25 mm b/d. Thus, not only was total US oil production likely understated at the end of 2022 and overstated at the end of 2023, but the growth we saw from 4Q22 to 4Q23 was closer to 0.5 mm b/d, rather than the reported 0.9 mm b/d.
Therefore, not only has oil production growth been overstated in 2023, but this leaves the market in a situation where 2024 oil production growth is likely to surprise to the downside from a purely accounting perspective (assuming the adjustment figure returns to the norm), but adjusted oil production has exhibited little to no growth since early 2023. This is something to which the reported headline figures do not represent.
Moving Forward, The Growth Struggle Is Likely to Continue
This leaves us in a situation where US oil production is set to struggle from an accounting perspective, but more importantly, fundamentals continue to suggest that outside of a production spike in reaction to a significant price spike (think $95+ WTI), production growth on the whole is unlikely to grow sustainably above existing levels.
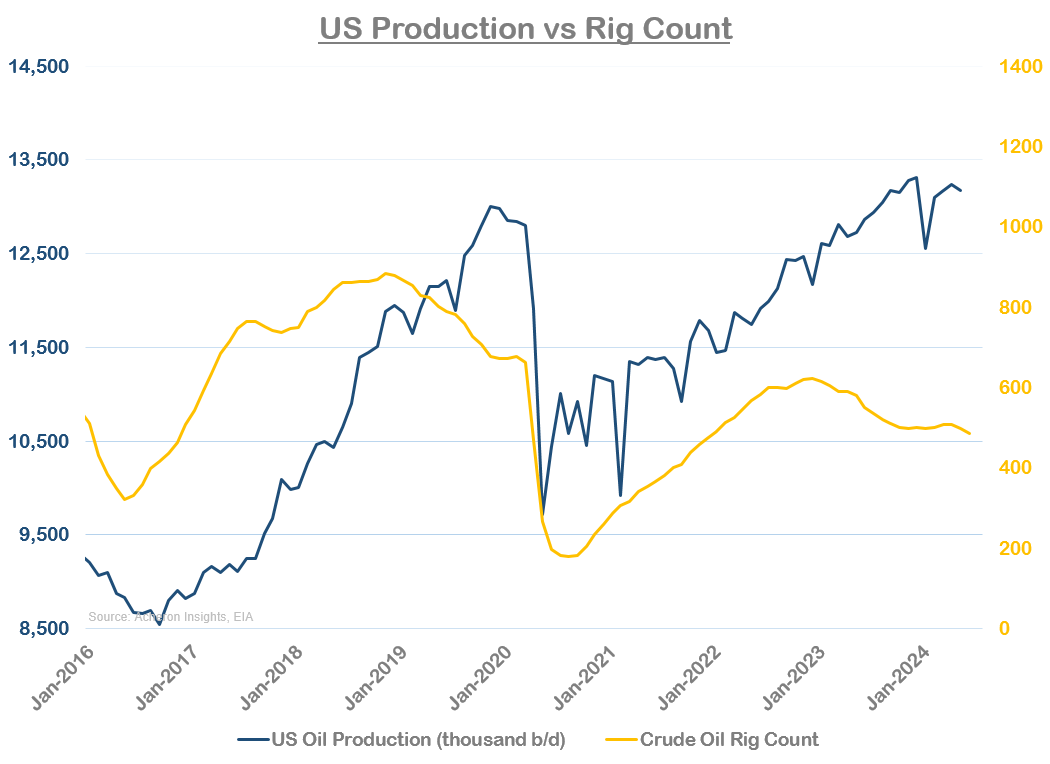
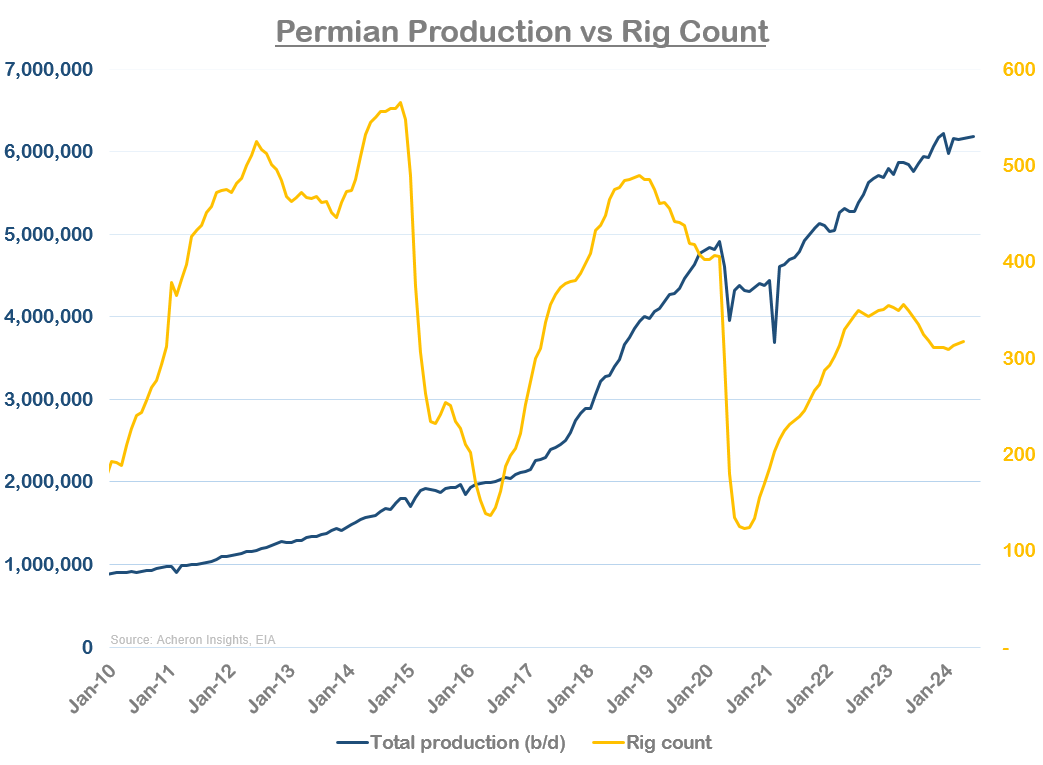
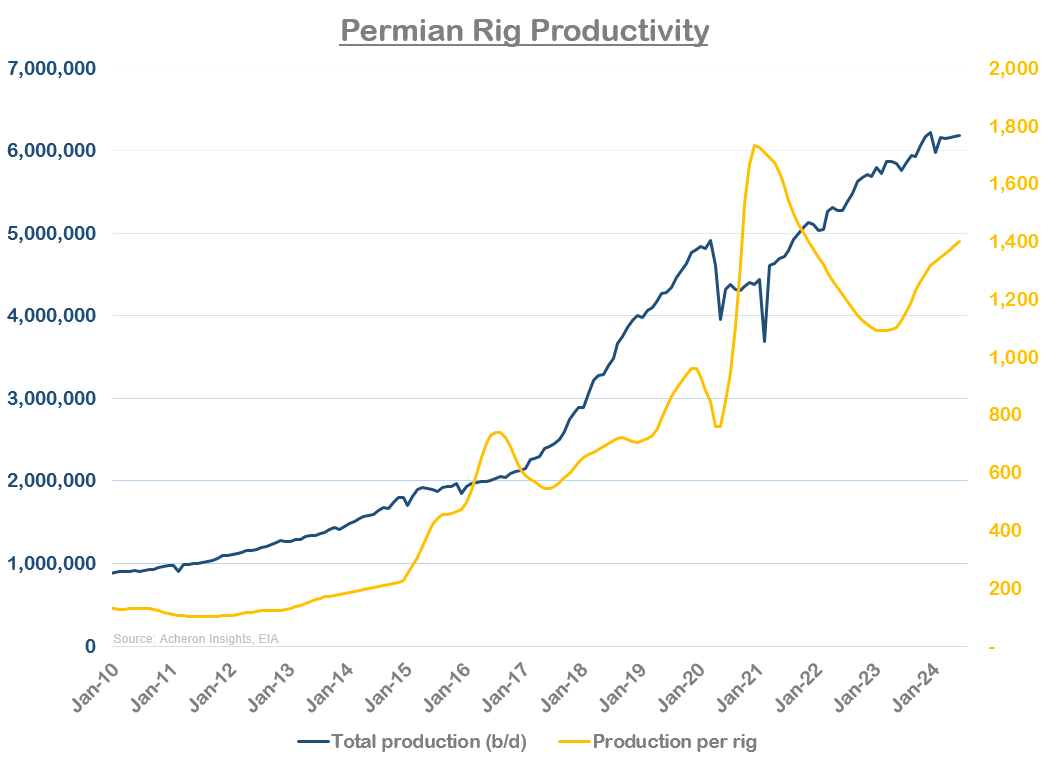
There are a number of signs that point toward stalling production growth. Perhaps the most prominent of which is the divergence between rig counts and production. Crude oil rigs in the US peaked at ~623 in late 2022 and have been in decline ever since. Production gains over the past 24 months have therefore primarily been a result of productivity gains.
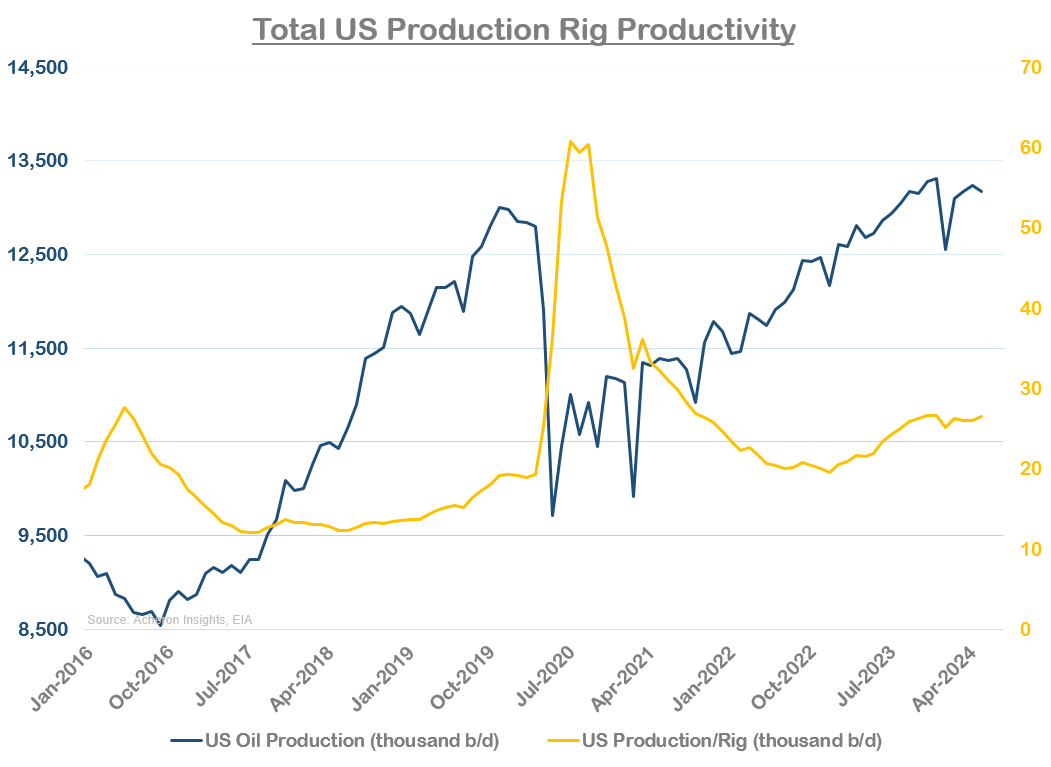
This is true of US production on the whole. But importantly, is especially true of Permian production, as we can see below.
In addition to falling rig counts and frac spreads, we are also seeing Drilled but Uncompleted Wells (DUCs) collapse. DUCs are oil wells that have been drilled but are not yet completed and thus are not ready to begin pumping, and are one representation of short-term potential supply as they generally reflect producers’ willingness to drill new wells.
Similar to oil rigs, DUCs have historically tracked oil prices and oil production but have diverged notably over the past 24 months.
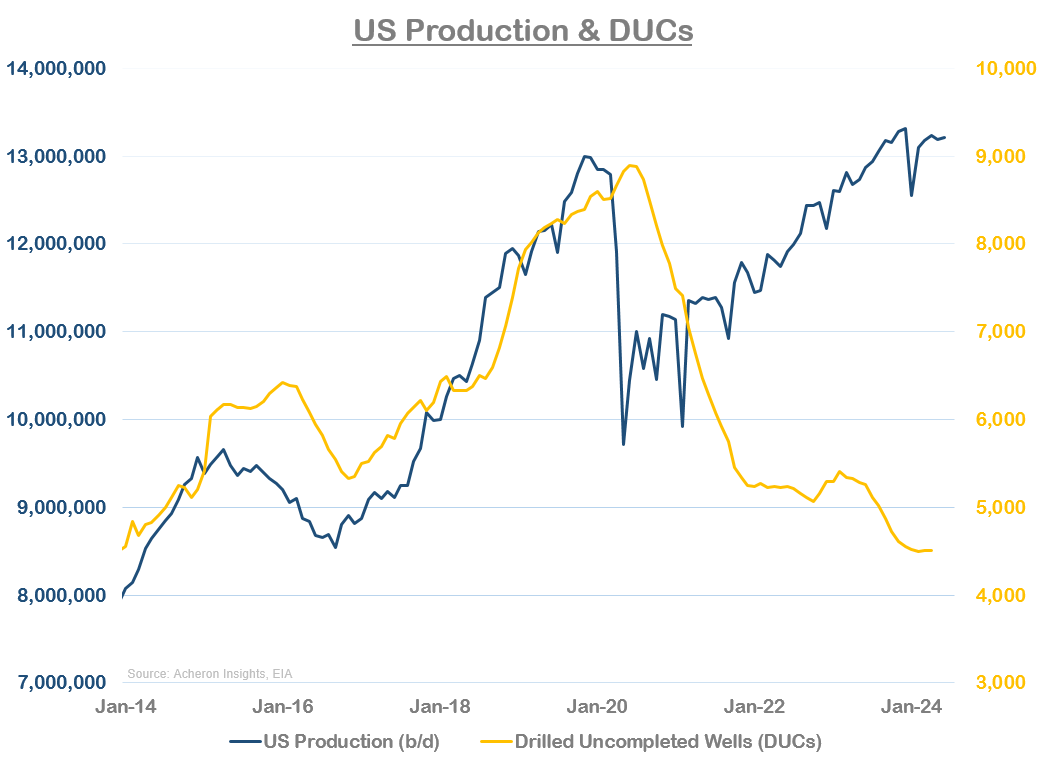
On its own, a decline in DUCs is not necessarily much of a signal, as a falling number of Drilled But Unemployed Wells could result not just from a decline in drilling activity, but could result from an increase in well completions (which would be positive for supply).
From mid-2020 up until the beginning of 2023 this is exactly what we saw. During this period, the DUC well count was declining while the completed well count was rising, meaning producers were completing more wells than they were drilling, explaining much of the increase in production during this period.
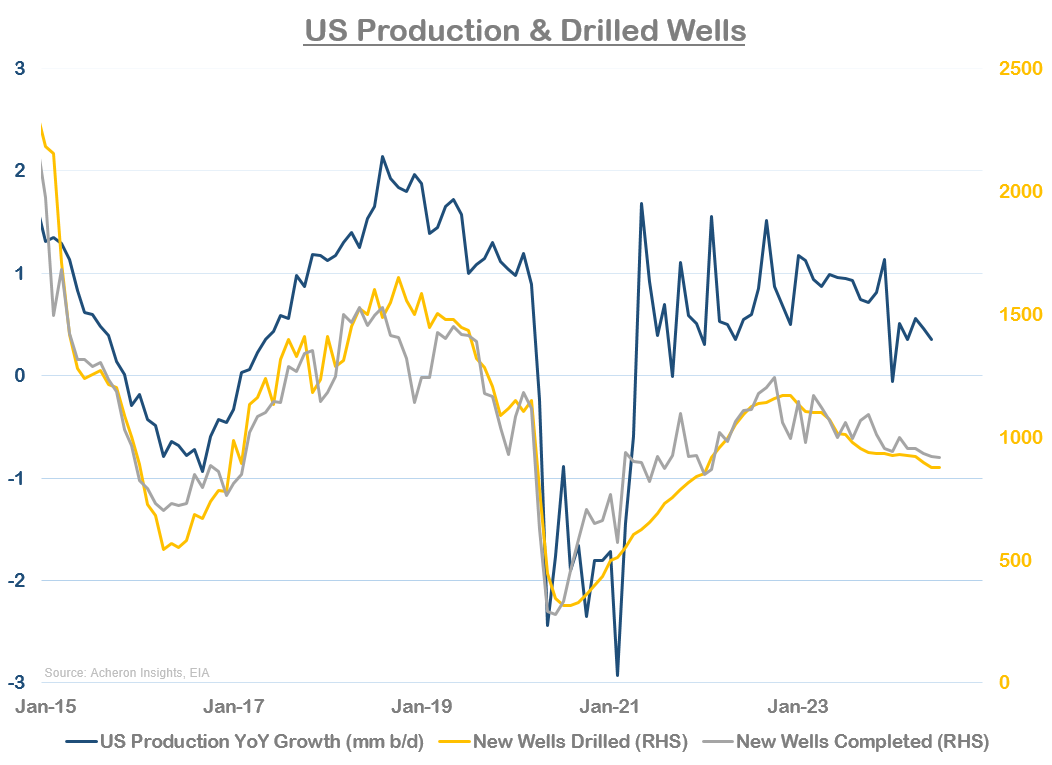
But, since early 2023, the DUC well count has continued its decline while the completed well count and number of new wells commenced also began to decline. As we can see above, the number of completed wells and new wells drilled are an excellent indicator of where production is headed (who’s monthly data from the EIA is reported on a lag).
Once again, this confirms that much of the production increase we saw in 2023 (which as we know, was already overstated) occurred as a result of increases in productivity.
There have been a number of factors driving these recent productivity gains, such as:
- Increased rates of production from newly completed wells from technology advancements and drilling techniques, such as longer lateral lengths and optimised well spacings. This has allowed producers to increase production with fewer rigs and completion crews;
- High grading, with producers optimising Tier 1 wells over Tier 2 wells; and,
- Private producers overproducing in hopes if cashing in on the recent M&A boom, likely a temporary phenomenon.
When we think about how sustainable these productivity gains are, we must remember that technology only goes so far. The ability to high grade Tier 1 wells is finite and efficiency gains will only be able to offset depletion for so long.
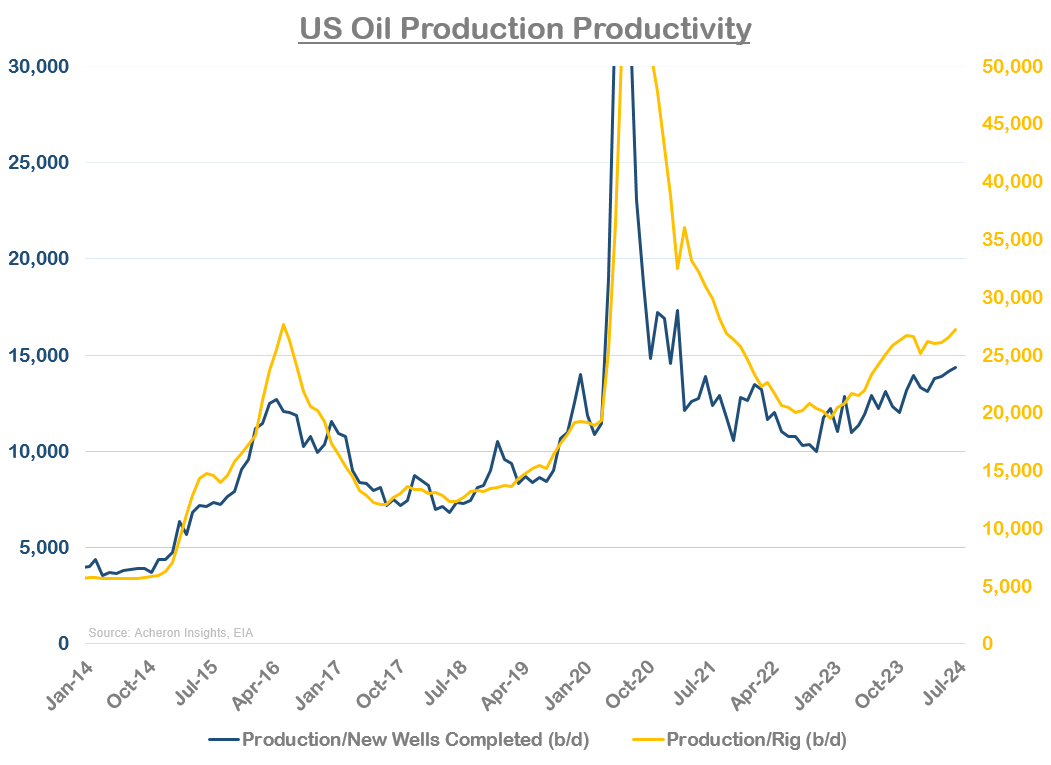
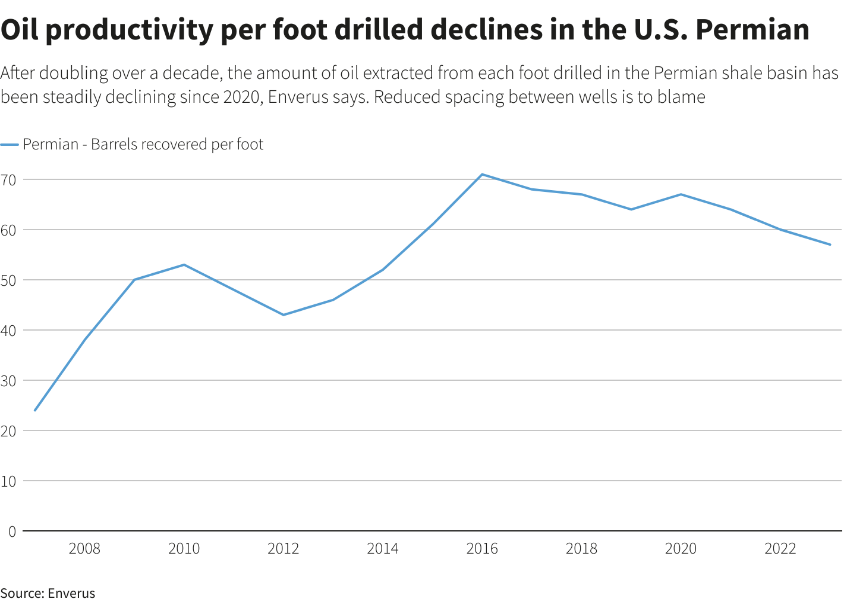
What’s more, even though we are seeing productivity increases via production per rig and production per newly completed well, oil productivity per foot drilled is in decline. This suggests that some of the productivity gains we have seen are actually a mirage (and perhaps attributable to overproduction from private producers), and that fracking is becoming less efficient as decades of drilling has resulted in too many wells close together, which are now interfering with underground pressure and making it more and more difficult to actually pump oil up from the ground.
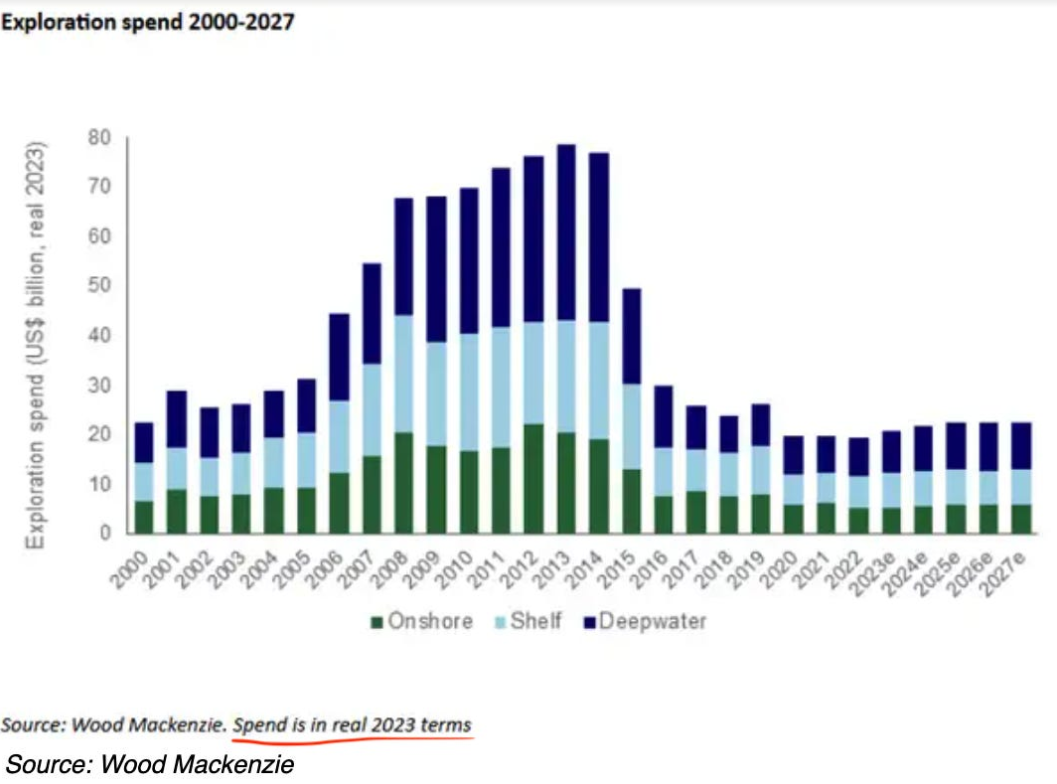
At some point, the divergence between production and rig counts and well completions will matter given we simply have not seen a commensurate rise in capital expenditures from oil exploration and production companies.
What’s more, most of the capex we have seen is in the LNG space along with some in the offshore space. The latter will be required to rise substantially if shale production is indeed close to plateauing.
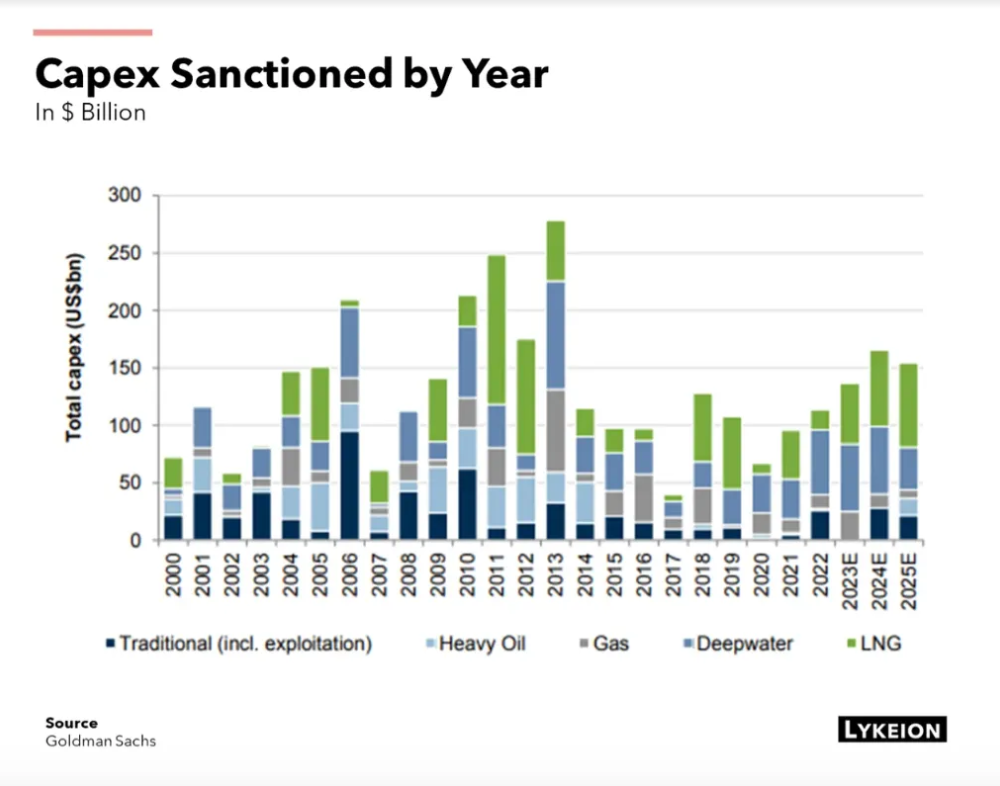
And if we measure capex in inflation adjusted terms, it has been flat for almost a decade now…
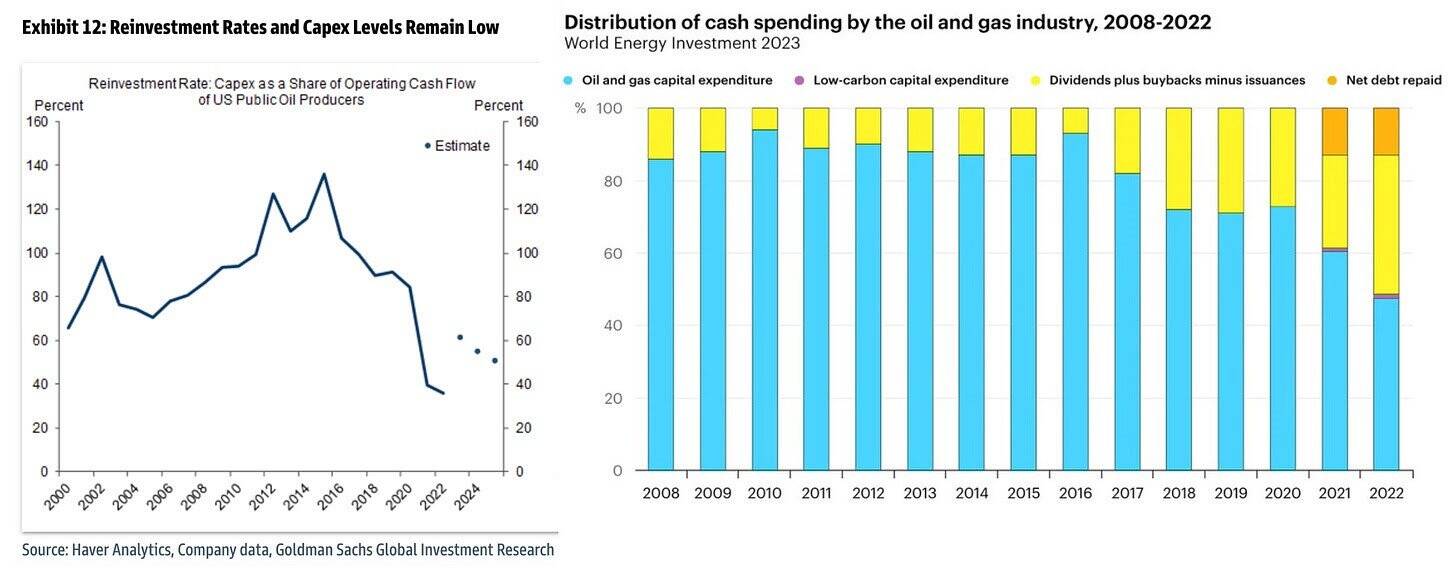
Producer discipline appears to be real. Reinvestment rates for oil producers are at multi-decade lows as management continue to favour debt repayments and returning capital to shareholders over exploration spending.
What’s more, depressed prices over the past 18 months suggests rig counts are highly unlikely to grow over the next four months at the very least. While this is likely to see modest increases in oil production into year end, it is unlikely to be anything close to the growth rates we are accustomed too.
As a result, productivity gains will only last so long, there will come a time where lack of capex, falling rigs/fracs and geology catch up. It seems we may be approaching that time.
Peak Shale Growth?
Whether US shale continues to grow for another six months, 12 months or 18 months, overall shale growth is much slower to the end than the beginning. Ultimately, US shale production growth will peak when Permian production peaks, and as we have seen, that may be sooner than we think.
There are other signals and analysis in addition to what I have presented thus far which reach a similar conclusion. Natural resources investment firm Geohring & Rozencwajg have done much work on the subject. Their work on the topic has led them to believe that once a shale play has produced 50% of its recoverable reserves, production growth peaks and starts to roll over (i.e. Hubbert’s Peak).
According to their analysis, this is exactly what unfolded in the Eagle Ford and Bakken shales, the two largest shale plays outside of the Permian. Neither has exhibit any additional growth since cumulative production exceeded 50% of total recoverable reserves back in 2019 and 2021 respectively. In relation to the Permian, according to their analysis, cumulative production is already around 40-45% of total recoverable reserves and quickly approaching the 50% threshold.
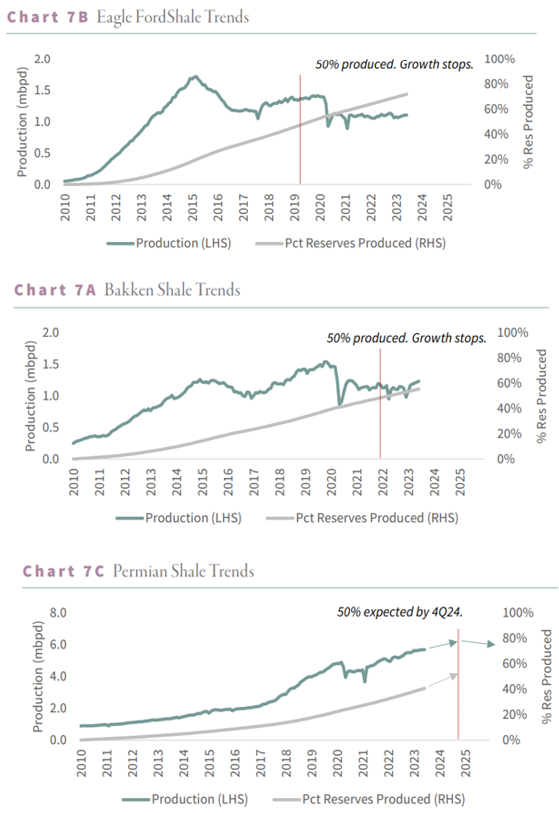
In addition to seeing production declines once cumulative production exceeds 50% of total recoverable reserves, Geohring & Rozencwajg also opine that production growth begins to decline meaningfully once 65% of a fields Tier 1 wells have been developed. Once again, this is what unfolded within the Eagle Ford and Bakken, and Geohring & Rozencwajg estimate that the Permian has already produced around 60% of its Tier 1 wells.
While I always take such research with a grain of salt (especially given Hubbert’s Peak is a controversial topic and their analysis and models are subject to a vast number of assumptions and estimates), it is still no doubt an important signpost of what’s in store from a production perspective. Should it hold true, tight oil production in the US is very close to peaking and may see little to no growth as soon as 2025.
Another signpost of peaking production growth from US shale is the increasing “gassiness” of oil and gas production. That is, the amount of natural gas and NGLs being produced relative to the amount of oil production is rising, as we can see below.
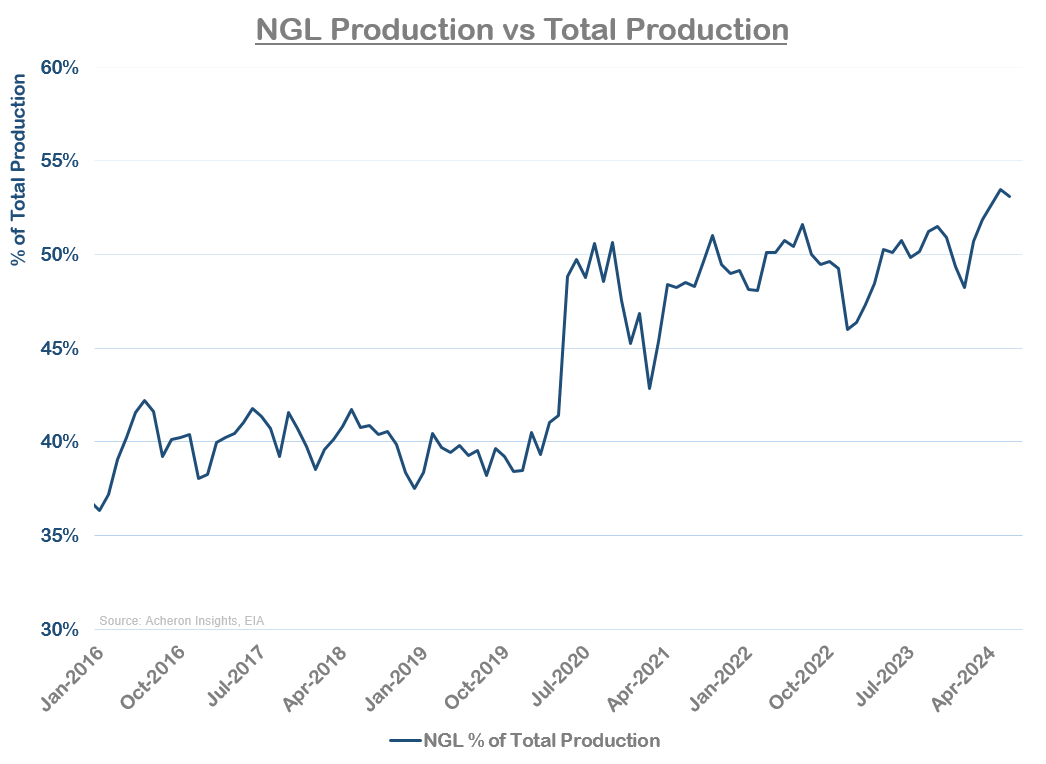
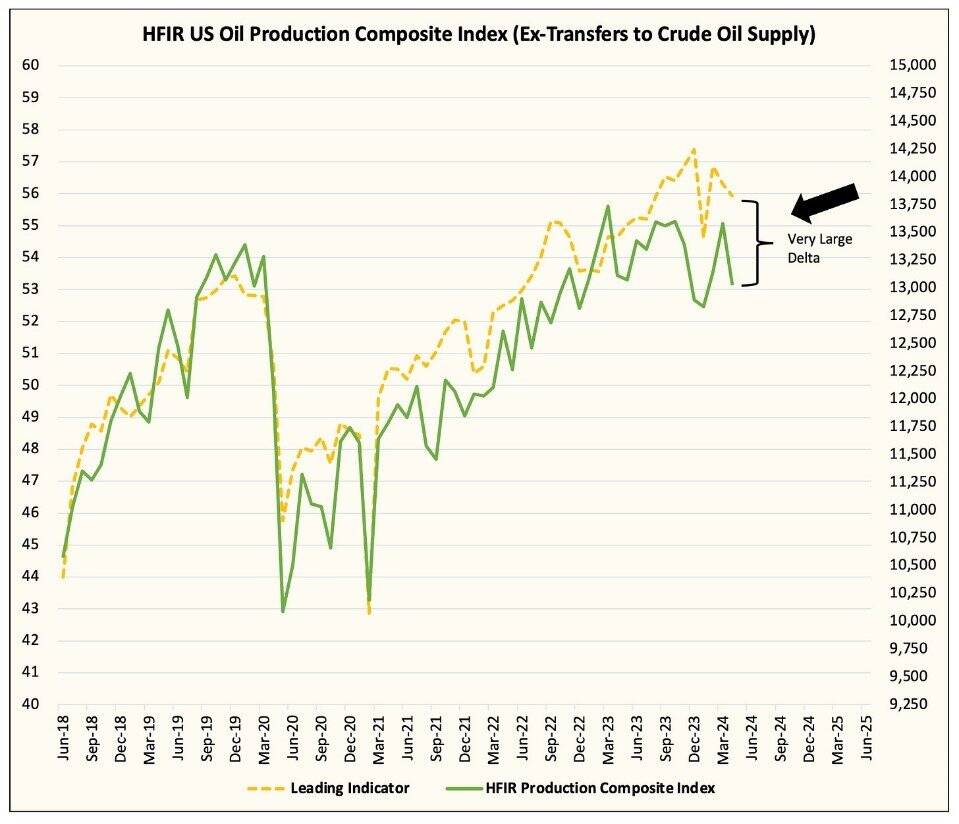
The below chart from HFI Research is perhaps a better illustration of this dynamic, as it shows associated gas production (yellow line) relative to oil production (green line). We can see how the past 12 months has seen a significant gap open up between the two.
While not a sure sign of declining production growth, some oil experts and geologists agree that increasing associated gas production relative to oil production is a sign of a maturing shale basin.
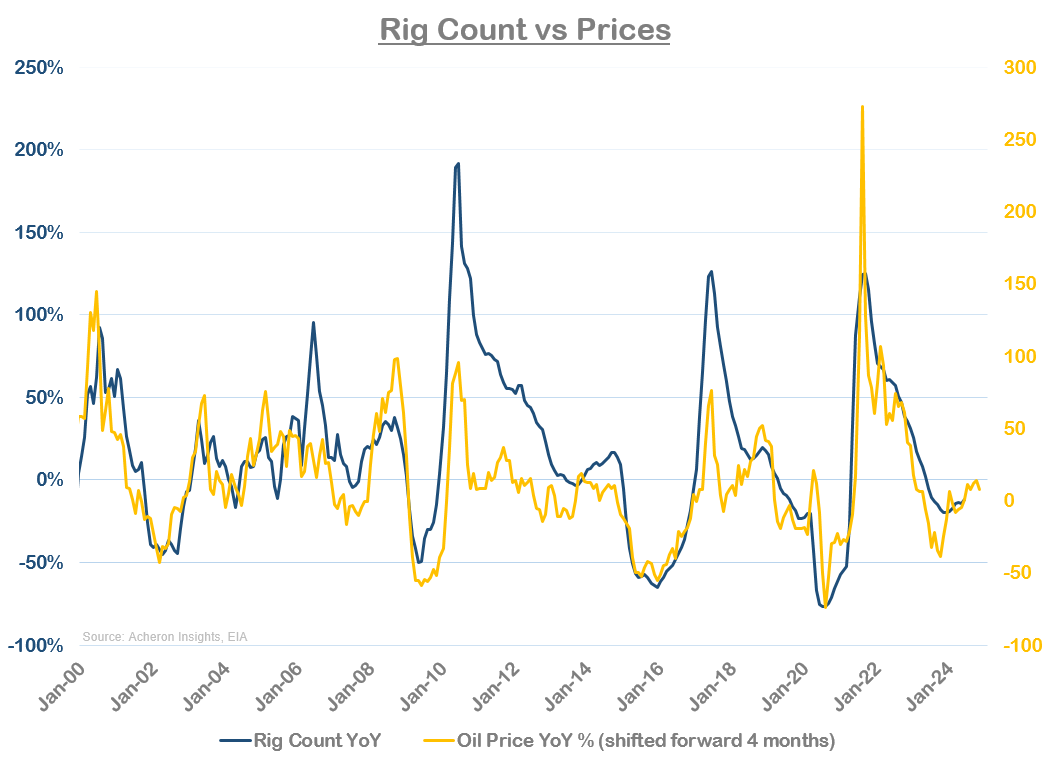
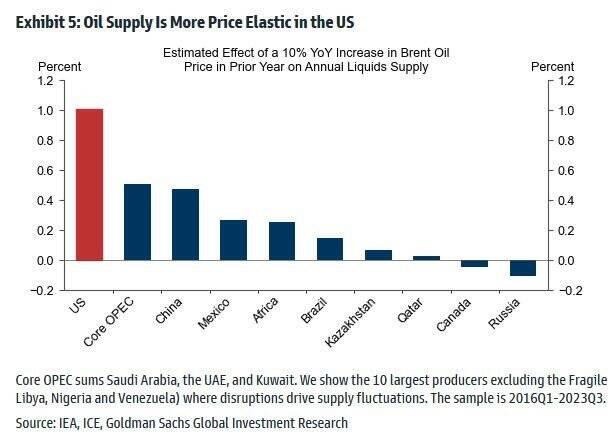
Does this mean US production growth is maxed out. Probably not. After all, US production still remains incredibly price sensitive, as we can see below.
This is a dynamic likely to be exacerbated by the recent M&A activity among US producers. As the larger public integrated oil companies continue to buy the smaller private producers, it stands to reason short-term production trends will become increasingly dependent on global oil prices, and smaller private producers are generally less price sensitive as they need to continuously drill in order to service debt payments. As such, should oil prices spike at some point, there will be some kind of production response in the US. It is the sustainability of that response that is in question.
Therefore, when we put these signals together, we seemingly get a reasonable basis for peaking US oil production. Whether that is in 2025 or 2026 remains to be seen, and even then, we are likely to see plateauing production for the remainder of the decade before any material decline, with short-term production changes likely subject to oil prices themselves. But if US oil production is peaking on net, it will have significant ramifications for oil prices over the medium-term.
The Big Picture
We must remember, US shale has been the largest source of non-OPEC supply growth over the past 15 years. If we lose the ~1 mm b/d annual growth shale has provided during this period, we are likely to see structural deficits in the oil market given the 1-1.5 mm b/d rise in demand we continue see each year.
This is how we could conceivably see triple digit oil prices once again at some point in the not-too-distant future.
It is also why we are likely to see continued oil exploration offshore, a dynamic that is a key driver of the investment case for offshore drilling and servicing firms, of which I am bullish.
Short-term Headwinds Versus the Long-term Bull Case
But we must remember these dynamics are likely to take some years still to unfold. In the short to medium-term, there is much to play out.
Firstly, while I believe their impact to be overstated, the market will need to contend with the unwinding of OPEC+’s 2.2 million b/d voluntary production cuts come December (with OPEC+ recently delaying this from October).
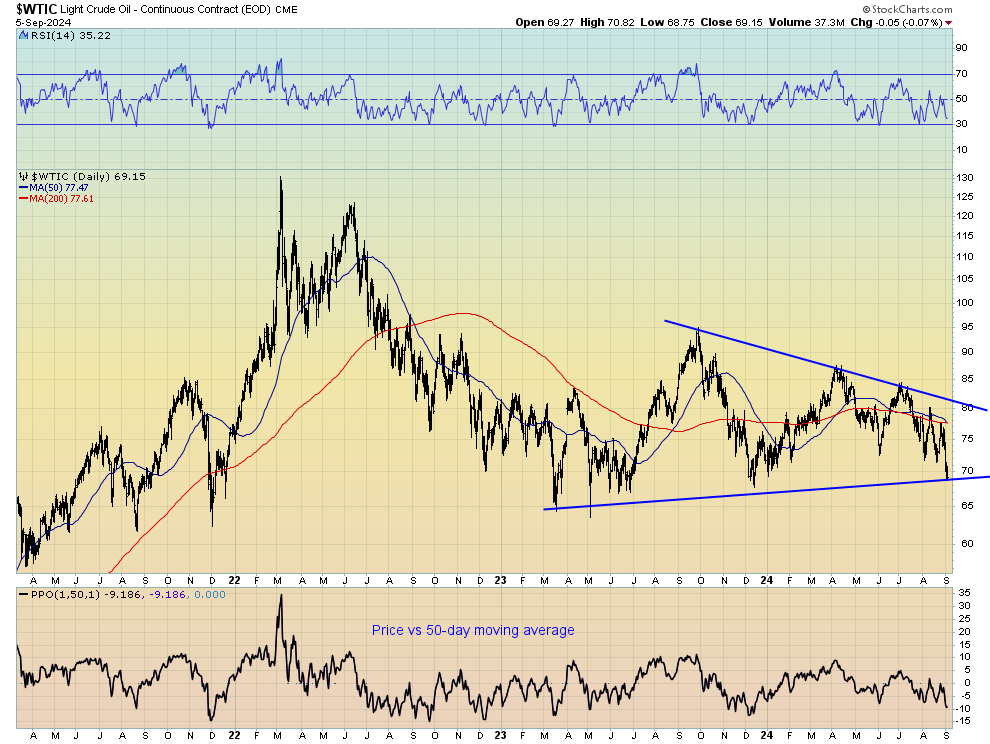
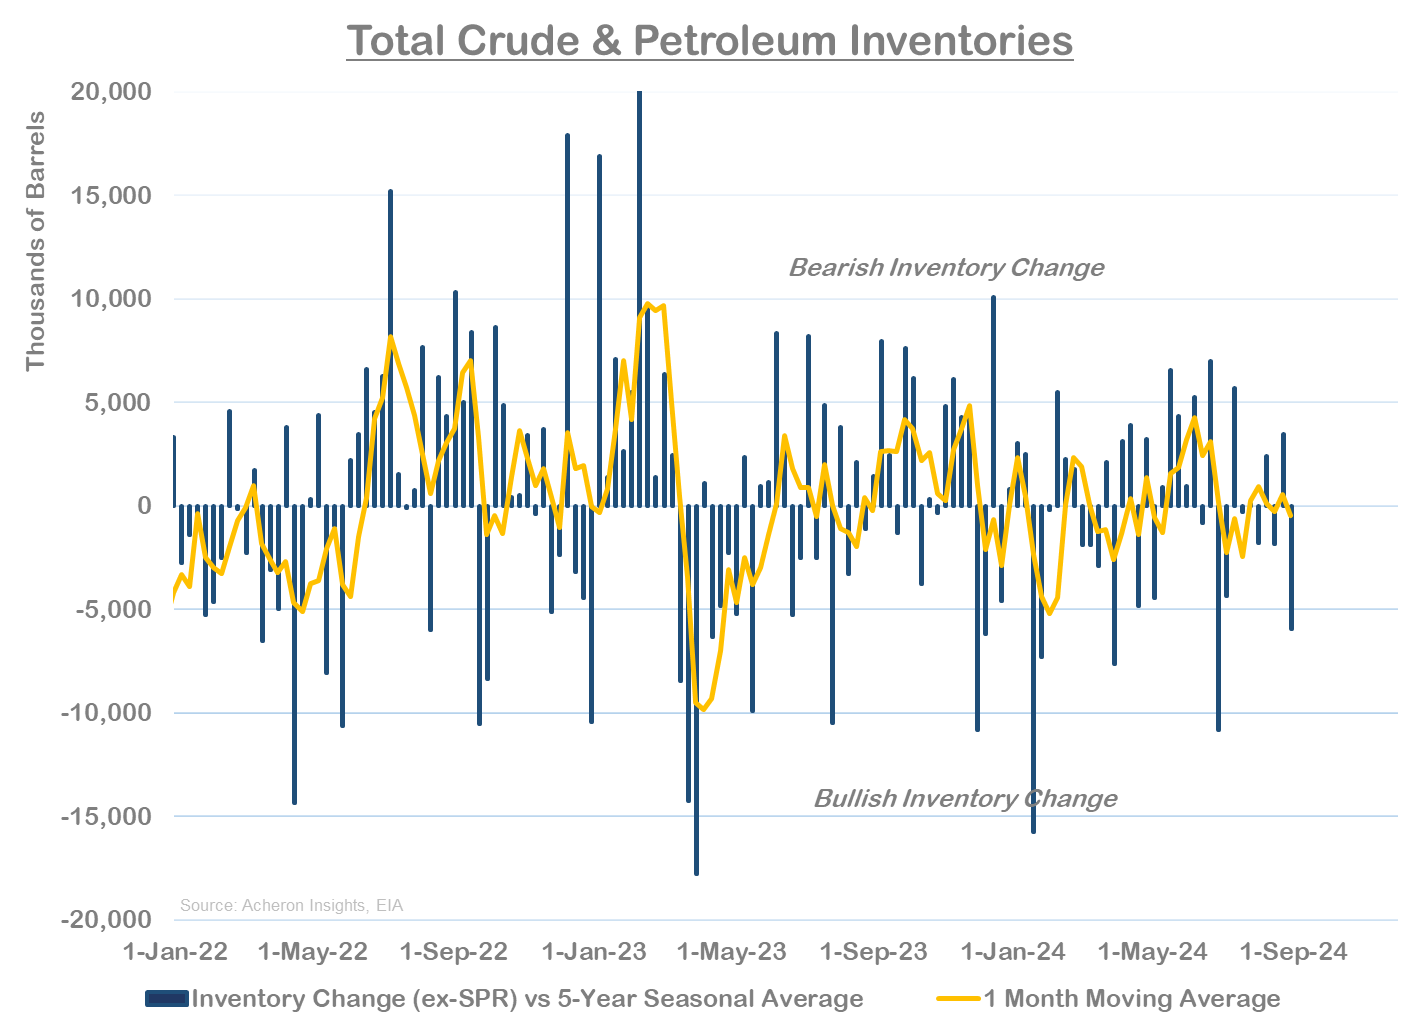
Current fundamentals are also far from bullish. While crude inventories are at relatively low levels, the inventory picture is relatively neutral. The fact is, these summer months simply have not seen enough seasonally bullish inventory changes to support a sustained rise in price, as we can see below.
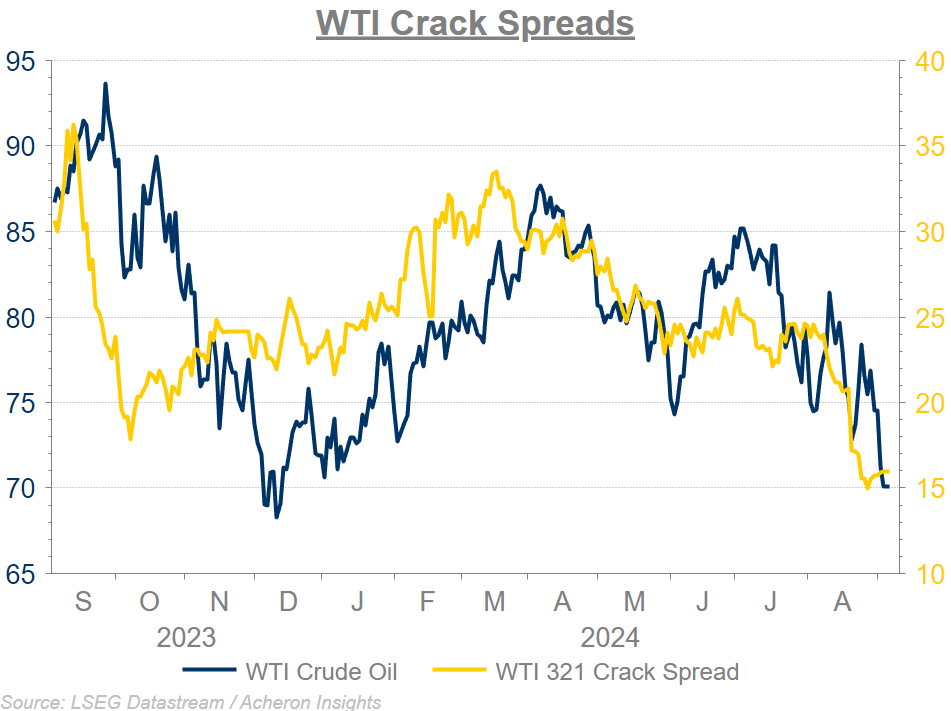
What explains much of this has been below average seasonal demand. A great proxy for this is crack spreads, which in the US have been plummeting since July, and are only now showing signs of stabilising.
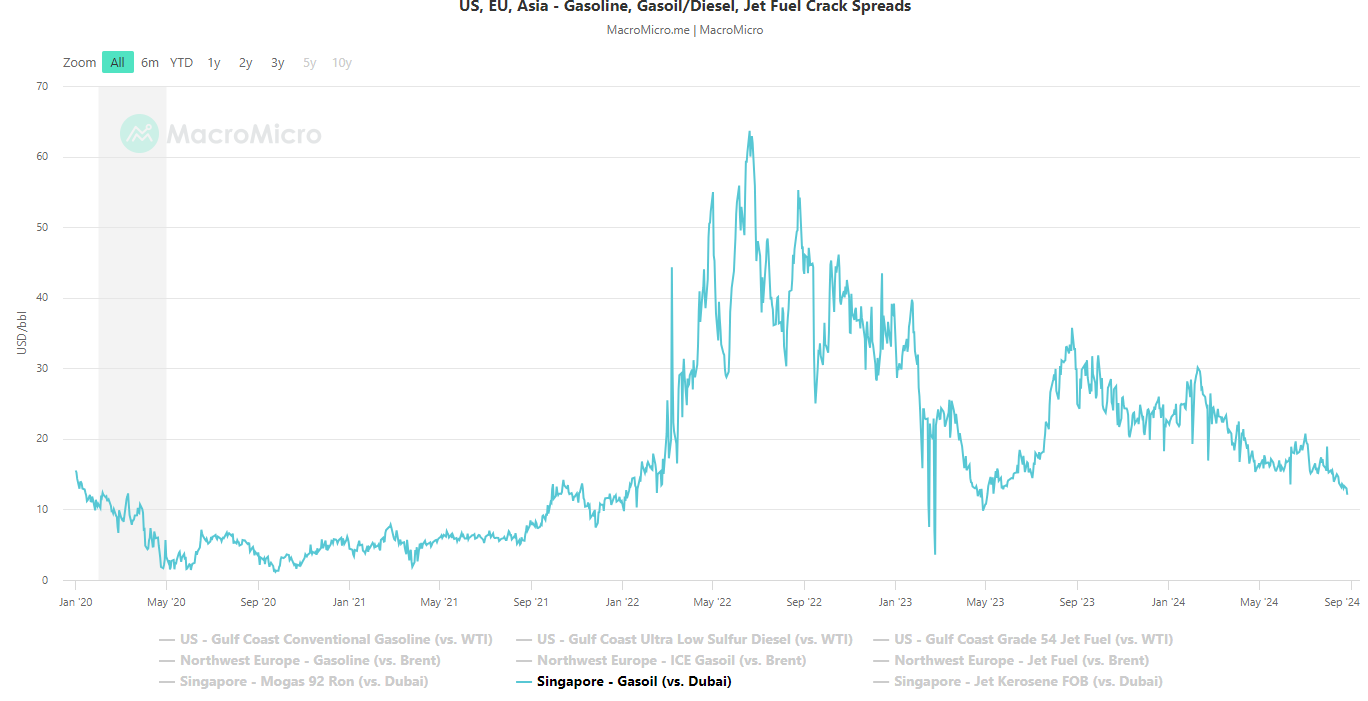
And perhaps even more importantly, global crack spreads have also been plummeting. Central to this has been Singapore gasoil cracks, which are an excellent proxy for Chinese demand.
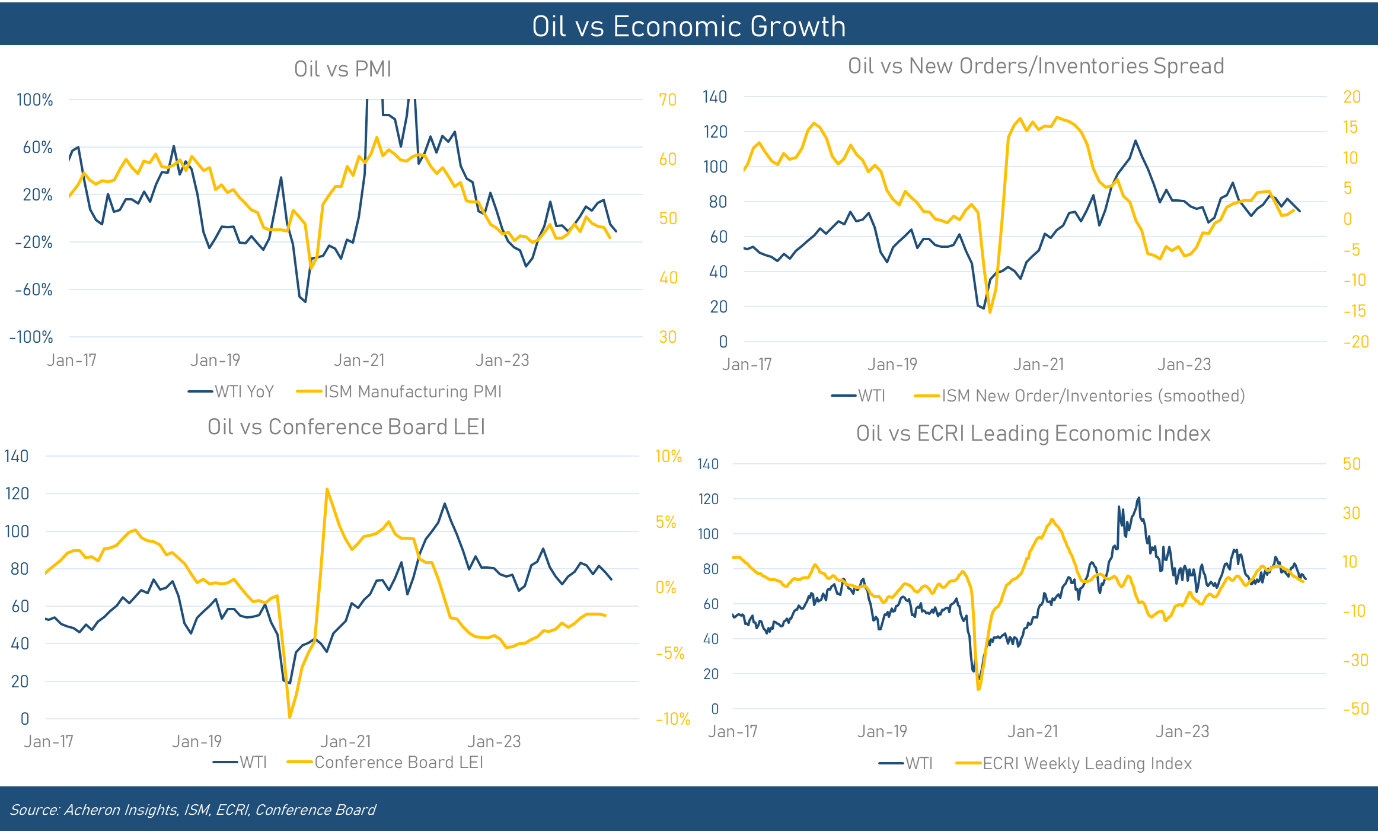
Confirming this recent lull in demand are several key short-term business cycle lead indicators, which we can see below compared to the oil price.
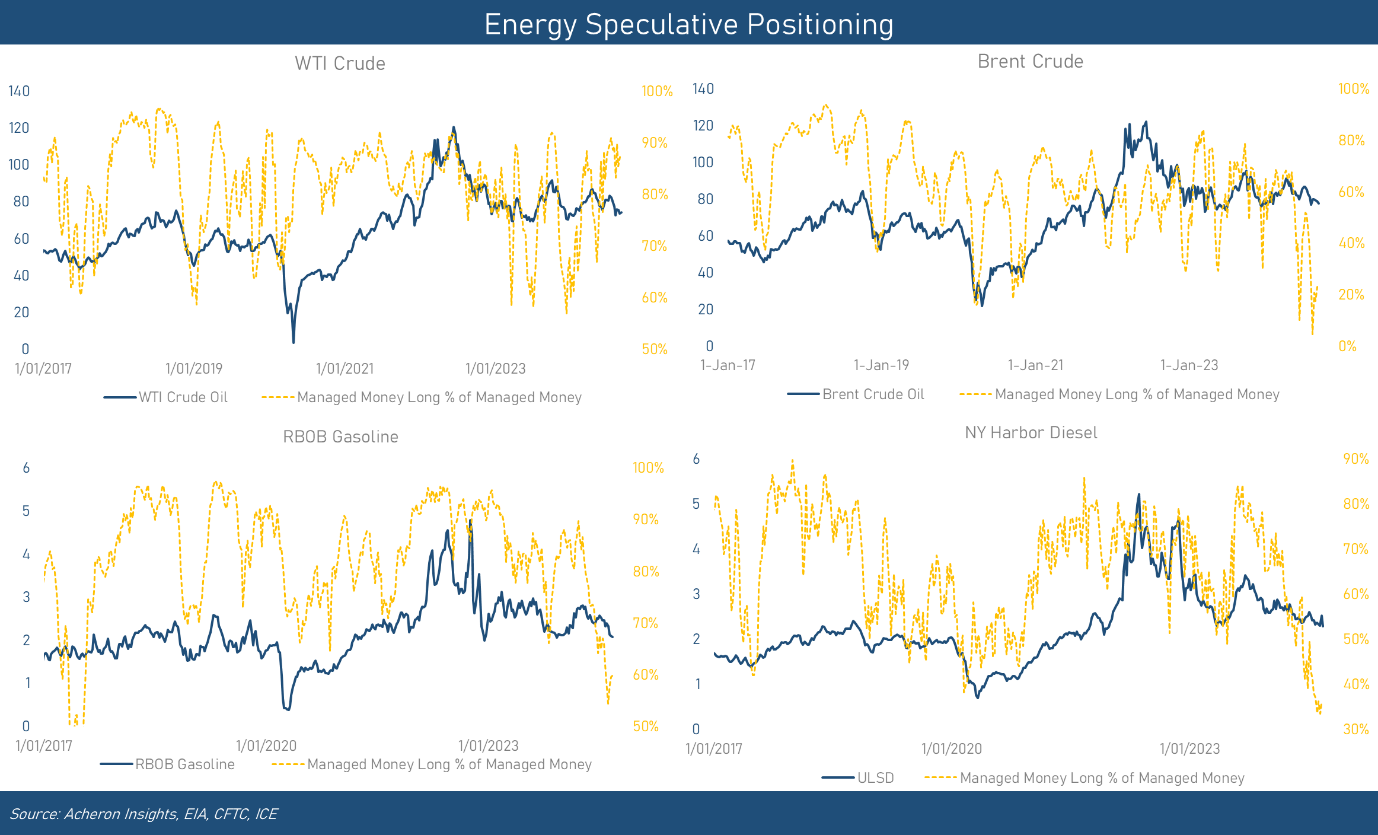
These dynamics have led to a shorting of gasoline and distillates futures like there is no tomorrow. Hedge funds and CTAs are also heavily net short Brent futures, which makes sense given weakness in Chinese demand. Positioning asymmetry for Brent, gasoline and diesel is now firmly to the upside. However, by my measurements, hedge funds and CTAs remain long WTI, which suggests we likely need to see some further unwilling in WTI longs before we see any material move to the upside in oil prices.
While we are probably close to a bottom in oil prices, I will become more confident of this once crack spreads stabilise and confirm a pick-up in demand. This in turn is likely to spark a buying frenzy by hedge funds and CTA’s. For those bullish the long-term oil thesis, then dips such as what we are seeing presently offer an excellent opportunity to buy into ones preferred energy businesses.
About the Author
Chris Yatescontributor
Chris is a finance professional with a passion for investing. His investment philosophy is centered around a "jack of all trades" approach, focusing on fundamentals, technicals, sentiment, macro themes and market structure.
Latest news and analysis


Advertisement