
Advertisement
Advertisement
XRP, ADA Price Prediction: Weak Bounces Trigger Strong Selloff Setups
By:
Key Points:
- XRP’s inverse cup-and-handle pattern signals a potential drop toward $1.22.
- ADA’s descending channel points to a retest of $0.50 support and possibly lower.
- Elevated U.S. interest rates amplify bearish pressure across altcoin markets.

XRP (XRP) and Cardano (ADA) are flashing alarming technical patterns that signal deeper losses ahead. Despite recent attempts to bounce, both altcoins remain under heavy bearish pressure, and broader macro fundamentals aren’t helping.
Federal Reserve Chair Jerome Powell plans to keep U.S. interest rates steady in the upcoming meeting on May 6-7, resisting political pressure from President Donald Trump to cut rates ahead of the election. The prospects of higher borrowing costs may pose downside risks to risk-on assets, including cryptocurrencies like ADA and XRP.
Let’s examine their technical setups to see how low they can go in the coming days or weeks.
XRP Technical Analysis: Inverse Cup and Handle Hints at Breakdown
The XRP/USD chart reveals a textbook inverse cup-and-handle pattern, a classic bearish continuation setup. After rallying toward $3.20 earlier this year, XRP has carved out a rounded top, confirming strong seller control.
The breakdown below the handle’s support zone around $2.10 raises the risk of a sharp decline. The measured move target, derived from the height of the cup, points to a drop toward $1.22, down 40%, and aligning closely with the 200-3D exponential moving average (EMA) near $1.32.
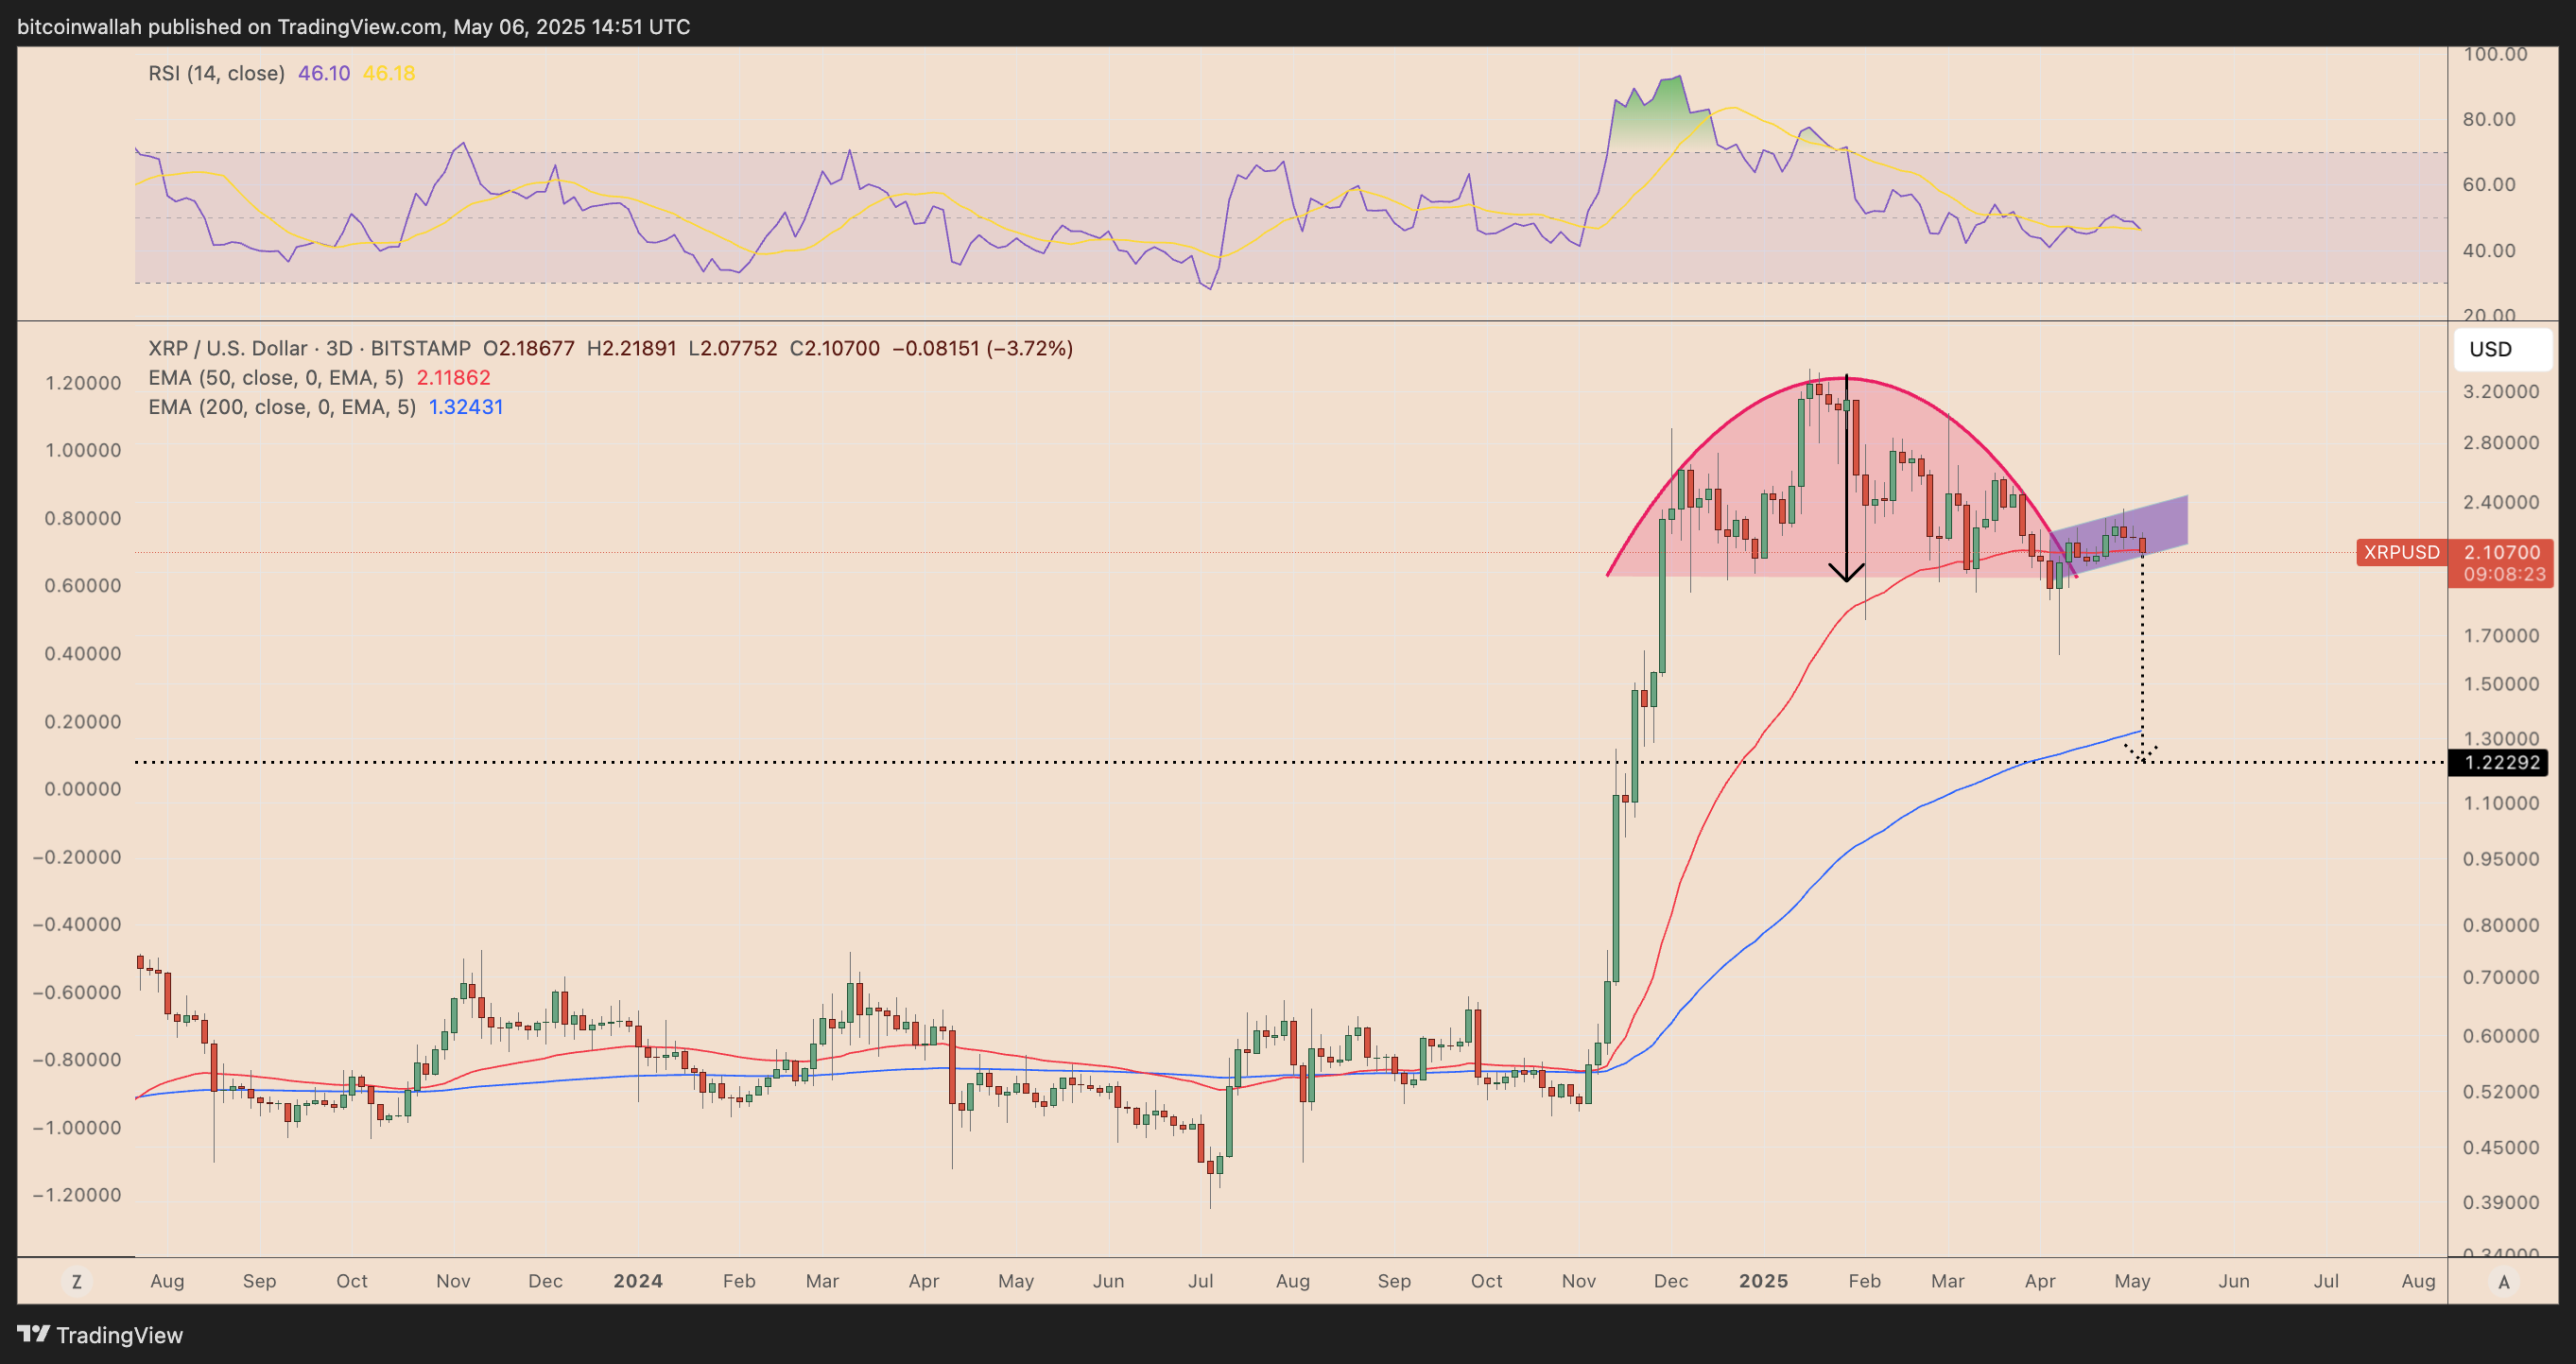
Momentum indicators back this bearish view. The Relative Strength Index (RSI) sits near 46, stuck in neutral-to-weak territory. Without a decisive push above the 50-3D EMA at $2.11, XRP looks vulnerable to cascading sell pressure.
ADA Technical Analysis: Descending Channel Targets Deeper Lows
Cardano’s ADA is trapped inside a descending channel that has guided price action since its November highs. Repeated failures to break above the upper trendline around $0.72 confirm persistent bearish momentum.
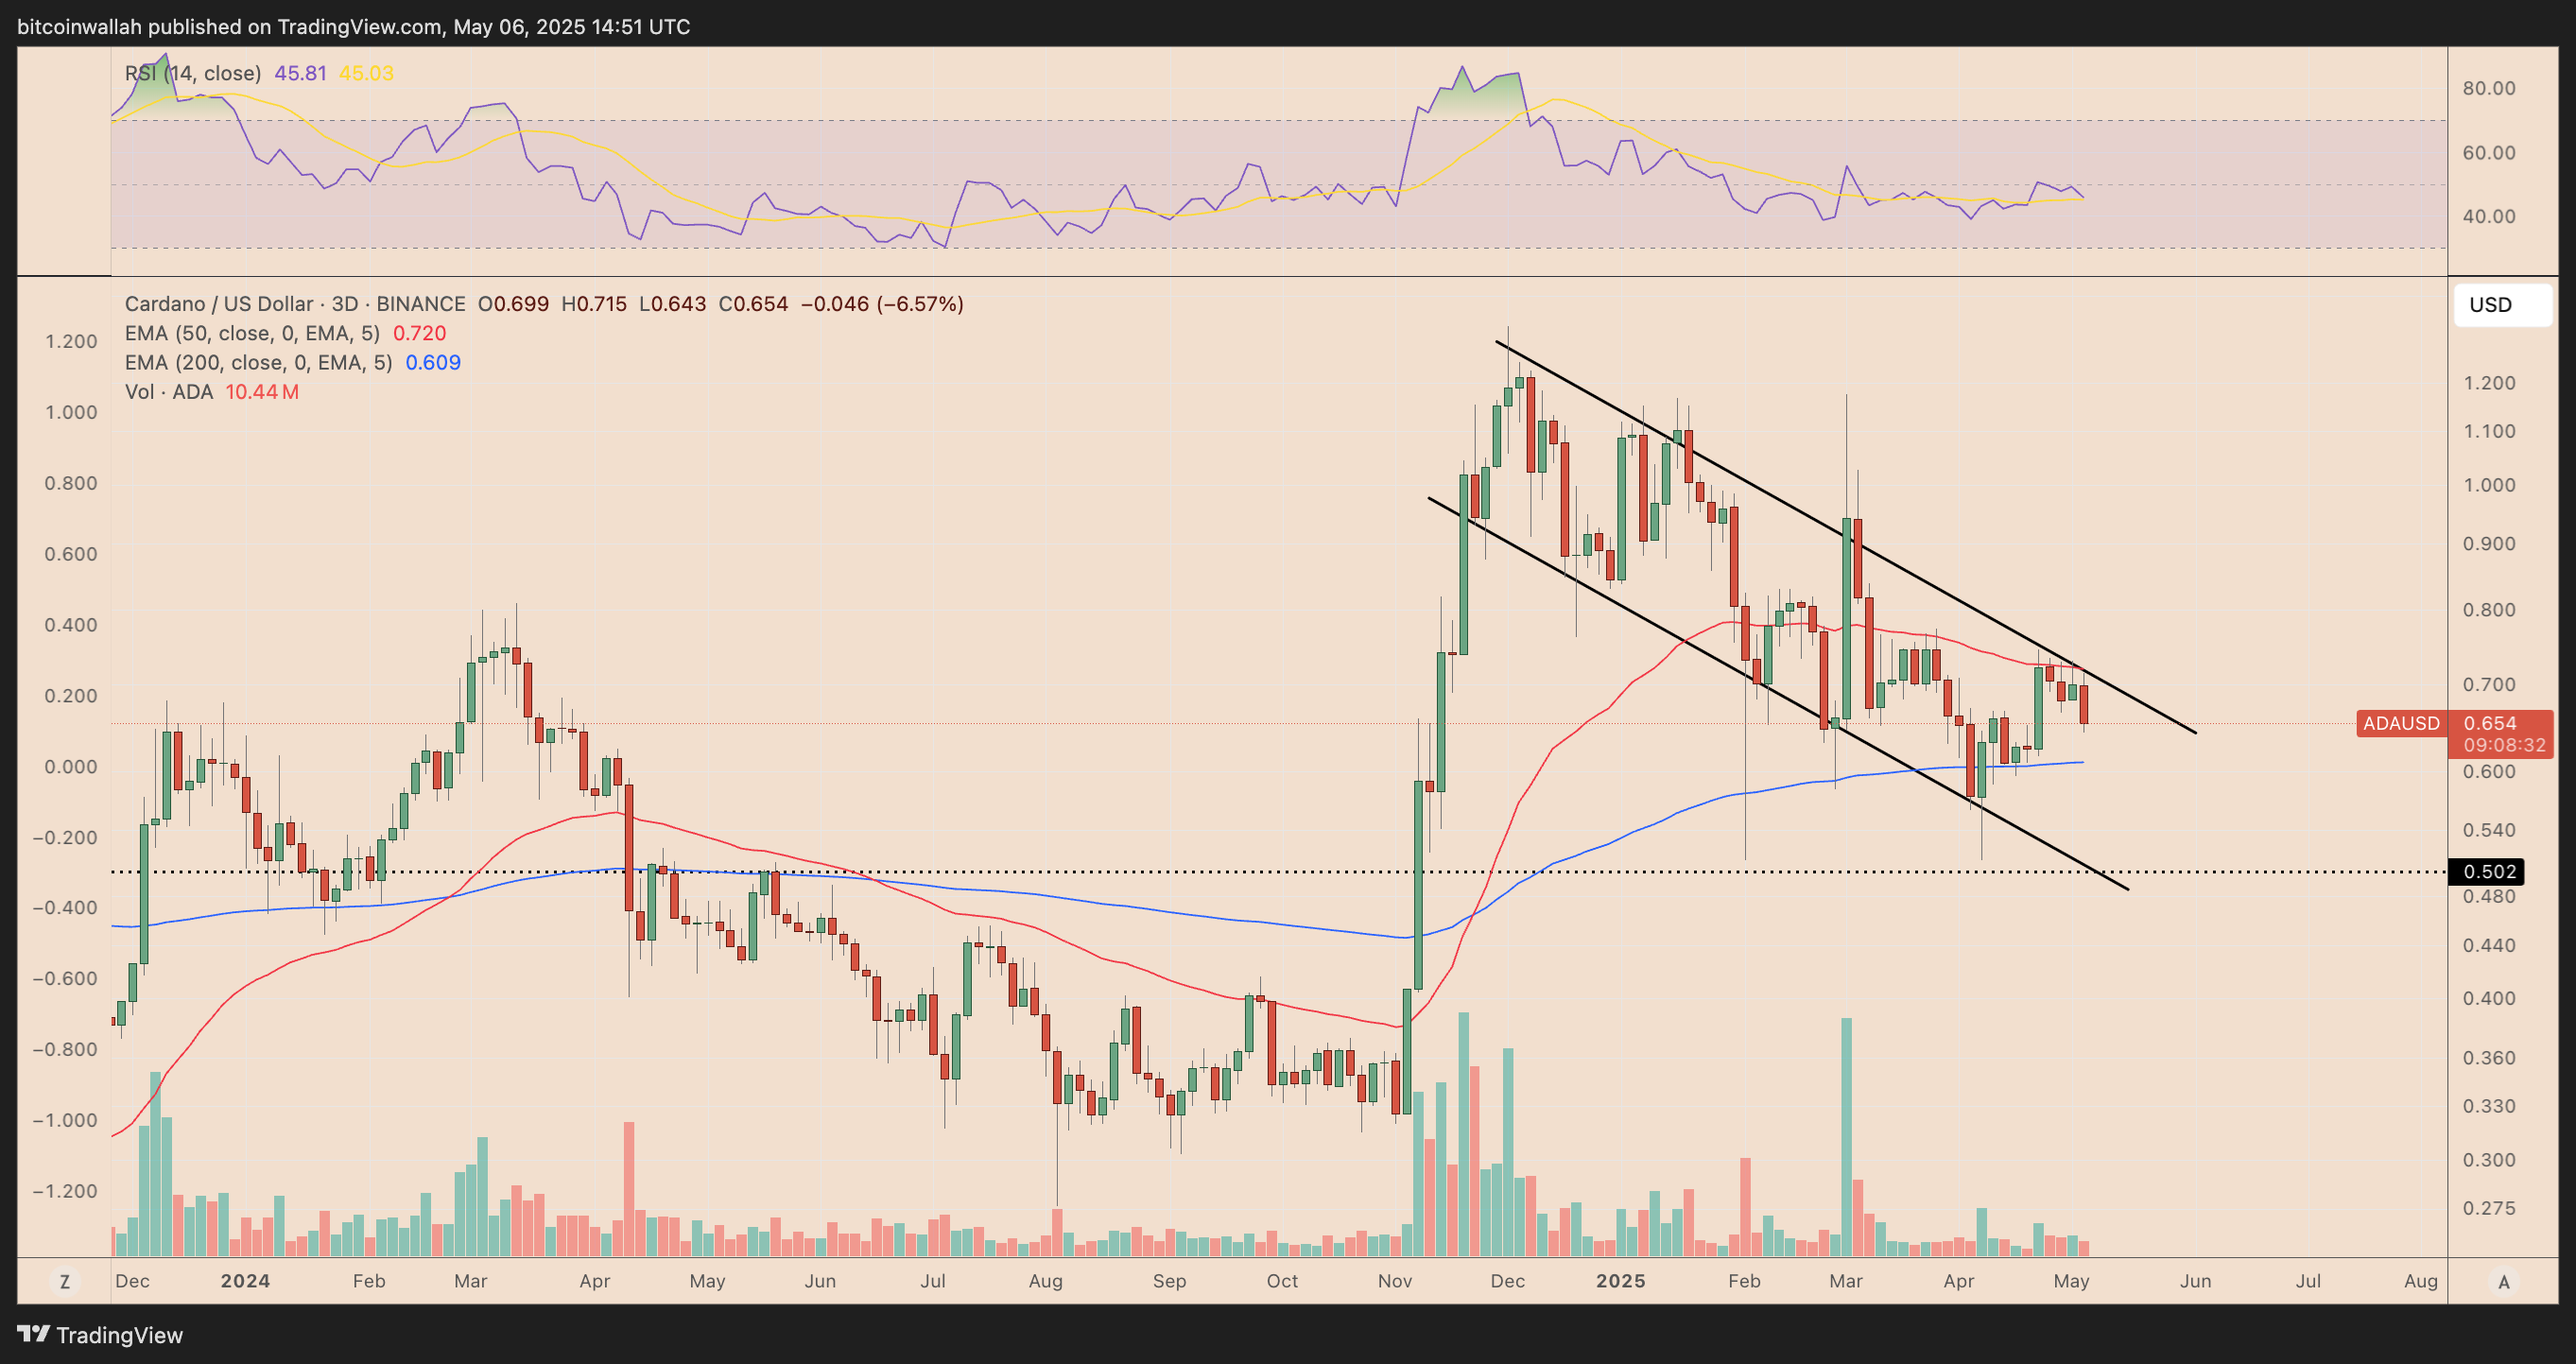
The most immediate downside target is $0.50, a level that served as critical support in late 2023 and is coinciding with the lower trendline. A breakdown below this threshold could lead to even steeper losses, particularly if trading volume increases on the decline.
ADA’s RSI hovers near 45, indicating subdued momentum. Unless ADA can reclaim its 50-day EMA at $0.72 and decisively break the channel’s upper boundary, the path of least resistance remains lower.
About the Author
Bob MasonChief Crypto Boss
123456789 30 He has written extensively for a broader audience and his current focus is on developments relating to the financial markets including, but not limited to currencies, commodities, alternative asset classes, and global equities.


Advertisement