
Advertisement
Advertisement
XRP Nears Key Support: Institutional DeFi Roadmap Meets Technical Turning Point
By:
Key Points:
- Descending wedge structure near key support levels
- RSI indicates oversold conditions, hinting at potential reversal
- Elliott Wave count suggests completion of corrective wave Y

Ripple (XRP) has been consolidating within a descending wedge pattern, suggesting an impending resolution as it approaches a key demand zone. The asset remains in a corrective phase, with price action aligning with Elliott Wave structures, particularly forming a potential final leg within a WXY correction.
This analysis examines XRP’s potential reversal zones, considering RSI momentum and Fibonacci retracements to project its next move.
XRP Ledger Charts Course for Institutional DeFi Expansion
Ripple Labs has unveiled a strategic roadmap to develop an institutional decentralized finance (DeFi) ecosystem on the XRP Ledger blockchain. The plan focuses on positioning XRP Ledger as a secure and scalable layer-1 solution tailored for financial institutions operating within regulated environments.
Key initiatives include the introduction of a permissioned decentralized exchange (DEX), a credit-based DeFi lending protocol, and a new multi-purpose token (MPT) standard. These components will leverage XRP Ledger’s decentralized identifiers to embed compliance checks directly into smart contracts. This roadmap builds upon existing infrastructure, such as price oracles and an automated market maker (AMM), aiming to enhance the network’s appeal to institutional participants and accelerate its growth in the DeFi sector.
XRP Price Analysis
The 4-hour chart outlines XRP’s prolonged corrective phase, characterized by a descending wedge structure. Following its previous impulsive wave to $3.40, the price began a WXY double-three correction, with wave W completing around $2.00 and wave X peaking near $2.90 before resuming a downtrend. The final wave Y now appears near completion as the price tests the critical demand zone between $1.95 and $2.05.
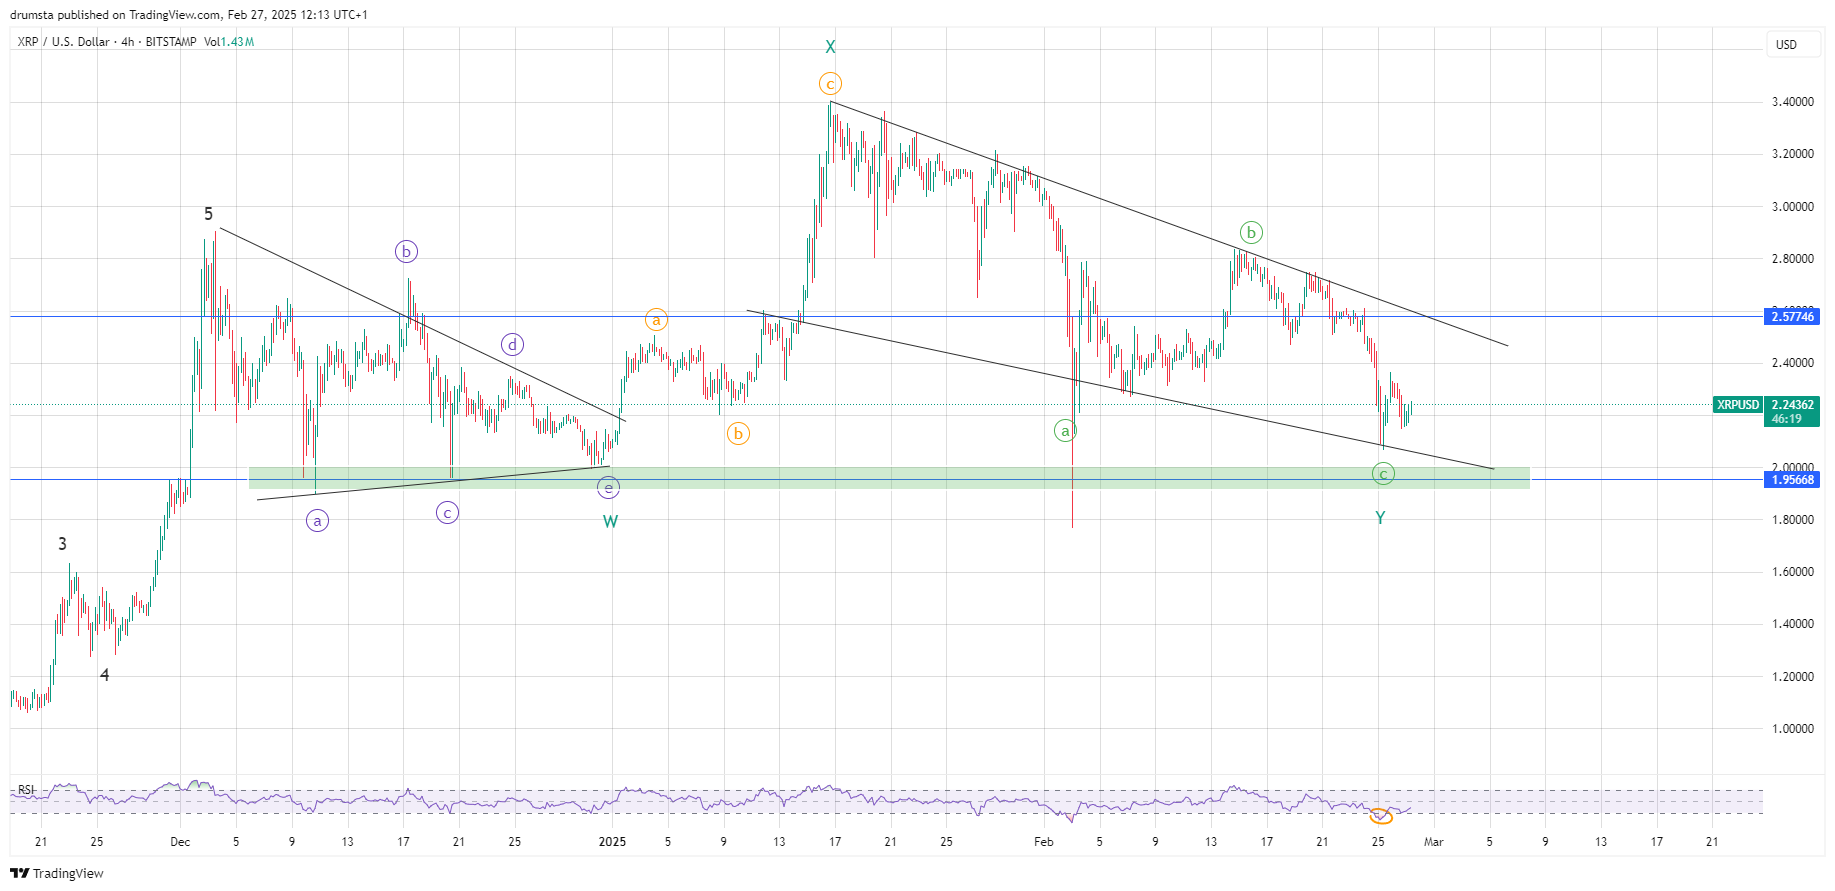
A closer look at the internal wave count shows an ABC structure within wave Y, where subwave C aligns with the lower wedge boundary, reinforcing confluence at the demand zone. Additionally, the RSI on the 4-hour timeframe has reached oversold levels, signaling exhaustion in selling momentum. Historically, similar conditions have preceded strong rebounds.
The descending wedge pattern further supports the probability of an imminent breakout, provided XRP sustains above $1.95. The last significant price rejection at this level suggests the presence of strong buyers. If a reversal is confirmed, an initial target would be the midline resistance of the wedge around $2.58, followed by a breakout attempt towards the $2.90 zone.
XRP Price Prediction
The 1-hour chart offers a more detailed look at XRP’s short-term structure, highlighting a potential bottoming scenario. The subwaves of the final C-leg appear to be unfolding within a five-wave structure, with wave (iv) currently forming a minor retracement before a potential last drop to complete wave (v).

The expected confluence zone between $1.95 and $2.05 aligns with multiple technical factors, including the 1.272 Fibonacci extension of wave (A) and historical support. If wave (v) finds support here, it could trigger a reversal, confirming the completion of the corrective phase.
In the bullish scenario, a break above $2.25 would indicate the beginning of a new impulsive structure. The first key target would be $2.58, where a 0.618 Fibonacci retracement aligns with prior support-turned-resistance. Further upside could see XRP testing $2.90, which coincides with the upper descending wedge boundary.
However, if XRP fails to hold above $1.95, a deeper retracement toward $1.75 cannot be ruled out, marking a potential invalidation zone for the bullish scenario.
Key Levels to Watch
- Immediate Resistance: $2.25 (minor structural resistance)
- Key Resistance: $2.58 (0.618 Fibonacci retracement)
- Critical Resistance: $2.90 (descending wedge breakout target)
- Immediate Support: $2.05 (historical demand zone)
- Key Support: $1.95 (descending wedge lower boundary)
- Invalidation Level: Below $1.75 (further downside risk)
About the Author
Bob MasonChief Crypto Boss
TEST 30 He has written extensively for a broader audience and his current focus is on developments relating to the financial markets including, but not limited to currencies, commodities, alternative asset classes, and global equities.
Latest news and analysis


Advertisement