
Advertisement
Advertisement
XRP Price Decreases 21% As Ripple Ledger Block Production Comes To A Halt
By:
Key Points:
- XRP found support near $1.95, rebounding after a significant drop.
- Elliott Wave count suggests a potential five-wave recovery in play.
- Descending trendline resistance remains critical for further upside.

XRP recently suffered a sharp decline, dropping nearly 11% in a single day, with a total 21% loss over the past week. This bearish move coincided with technical issues on the XRP Ledger, which experienced an hour-long halt in block production, sparking concerns among traders. While the network has since resumed normal operations, market sentiment remains fragile. The provided charts suggest XRP may be attempting a recovery, but key resistance levels stand in the way.
Ripple Ledger Stops Block Production
On February 5, 2025, XRP experienced a significant decline, dropping nearly 11% within 24 hours to a price of $2.41. Over the past week, the cryptocurrency has shed 21% of its value, marking one of the most substantial losses among top digital assets.
This downturn coincided with technical issues on the XRP Ledger, which halted block production for approximately an hour on February 4 before resuming normal operations. The cause of the halt is under investigation, with initial analyses pointing to a consensus issue where validations were not being published, causing the network to drift apart.
XRP Price Analysis
XRP’s 4-hour chart shows a completed five-wave Elliott Wave impulse, peaking around $3.00 on Dec., followed by a WXY corrective structure that made a higher high of $3.40 on Jan 16. Despite reaching higher values, this was the second wave X and was followed by a decline to $1.80 at its lowest point on Feb. 3.
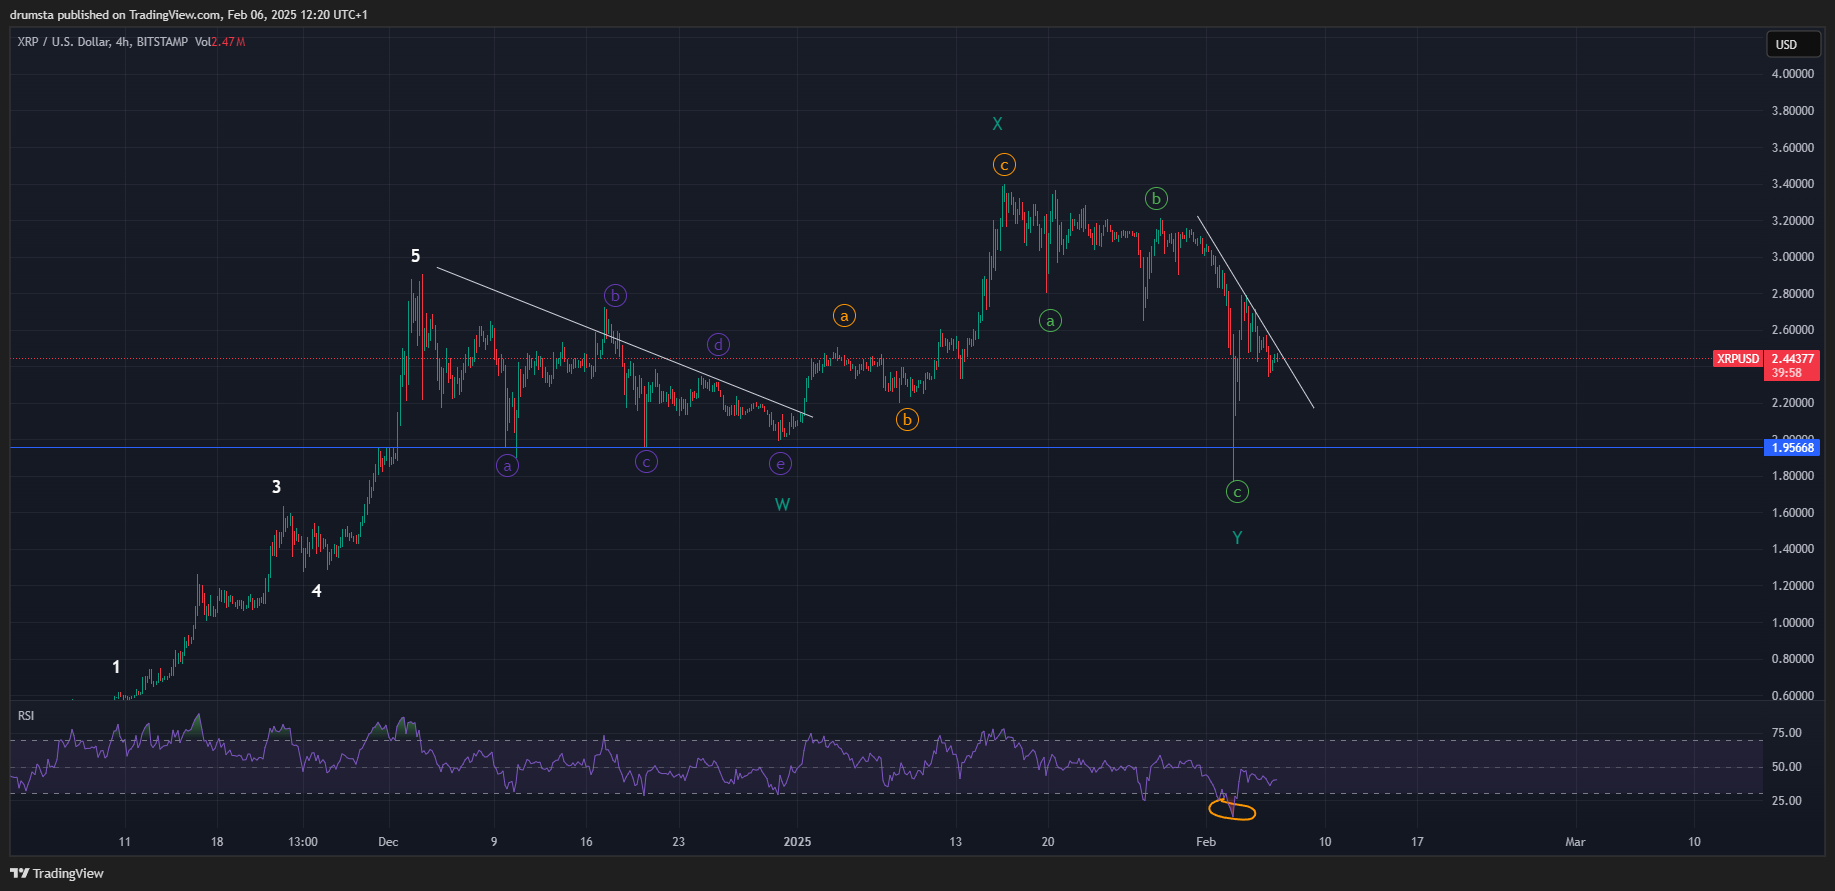
This level aligns with a historical horizontal support zone, suggesting a potential bottom formation. The price rebounded sharply from this level, but momentum remains uncertain as it approaches key resistance levels.
The RSI on the 4-hour chart hit deeply oversold conditions, a rare occurrence that often precedes a trend reversal or at least a relief rally. Additionally, XRP is trading near a descending trendline, which has acted as resistance in previous attempts to push higher. A successful breakout above this level would confirm the start of a new bullish impulse, while rejection could lead to further downside or prolonged consolidation.
If XRP remains above $2.32, it maintains a bullish structure, but losing this level could indicate further downside toward the $1.95 support zone.
Overall, while the rebound from $1.80 is encouraging, confirmation of an uptrend requires a breakout above descending resistance and sustained momentum past the key Fibonacci retracement levels. Until then, XRP remains in a recovery phase with risks of further consolidation.
XRP Price Prediction
The 1-hour chart suggests XRP is attempting to start a five-wave recovery, with an initial breakout attempt above $2.55 underway. If this pattern holds, wave (iii) could push toward $3.86 (1.618 Fibonacci extension), with final wave (v) targets near $4.23 to $4.49, aligning with higher timeframe Fibonacci levels.

Currently, XRP is in wave (ii) of a potential bullish impulse, retesting key support around $2.32. If it holds, wave (iii) should see an increase in volume and momentum, confirming a short-term uptrend. However, if XRP fails to break above the descending trendline, the recovery structure remains weak, and another retest of $1.95 could occur before a stronger bounce.
RSI on the 1-hour chart is recovering from oversold conditions, indicating a possible momentum shift. However, a lack of strong buying pressure could lead to sideways consolidation, delaying the expected upside move. Traders should watch for a breakout confirmation above $2.80, as it would strengthen the case for a rally toward $3.86 and beyond.
A failure to hold $2.32 would invalidate the bullish scenario, potentially leading to a lower low near $1.95, where XRP previously found support. The overall outlook remains tentatively bullish, but confirmation is needed through volume and price action above key resistance zones.
Key Levels to Watch
- Immediate Resistance: $2.55 (0.236 Fibonacci retracement)
- Key Resistance: $3.08 (0.618 Fibonacci retracement)
- Major Bullish Target: $4.23–$4.49 (Wave (v) Fibonacci extensions)
- Immediate Support: $2.32 (trendline support)
- Critical Support: $1.95 (previous swing low)
About the Author
Bob MasonChief Crypto Boss
TEST 30 He has written extensively for a broader audience and his current focus is on developments relating to the financial markets including, but not limited to currencies, commodities, alternative asset classes, and global equities.
Latest news and analysis


Advertisement