
Advertisement
Advertisement
AUD/USD, NZD/USD, USD/JPY Analysis: Trade Tensions Rise After Steel and Aluminium Tariffs
By:
Key Points:
- AUD/USD consolidates within a symmetrical broadening wedge.
- NZD/USD forms bullish price action within a symmetrical broadening wedge pattern.
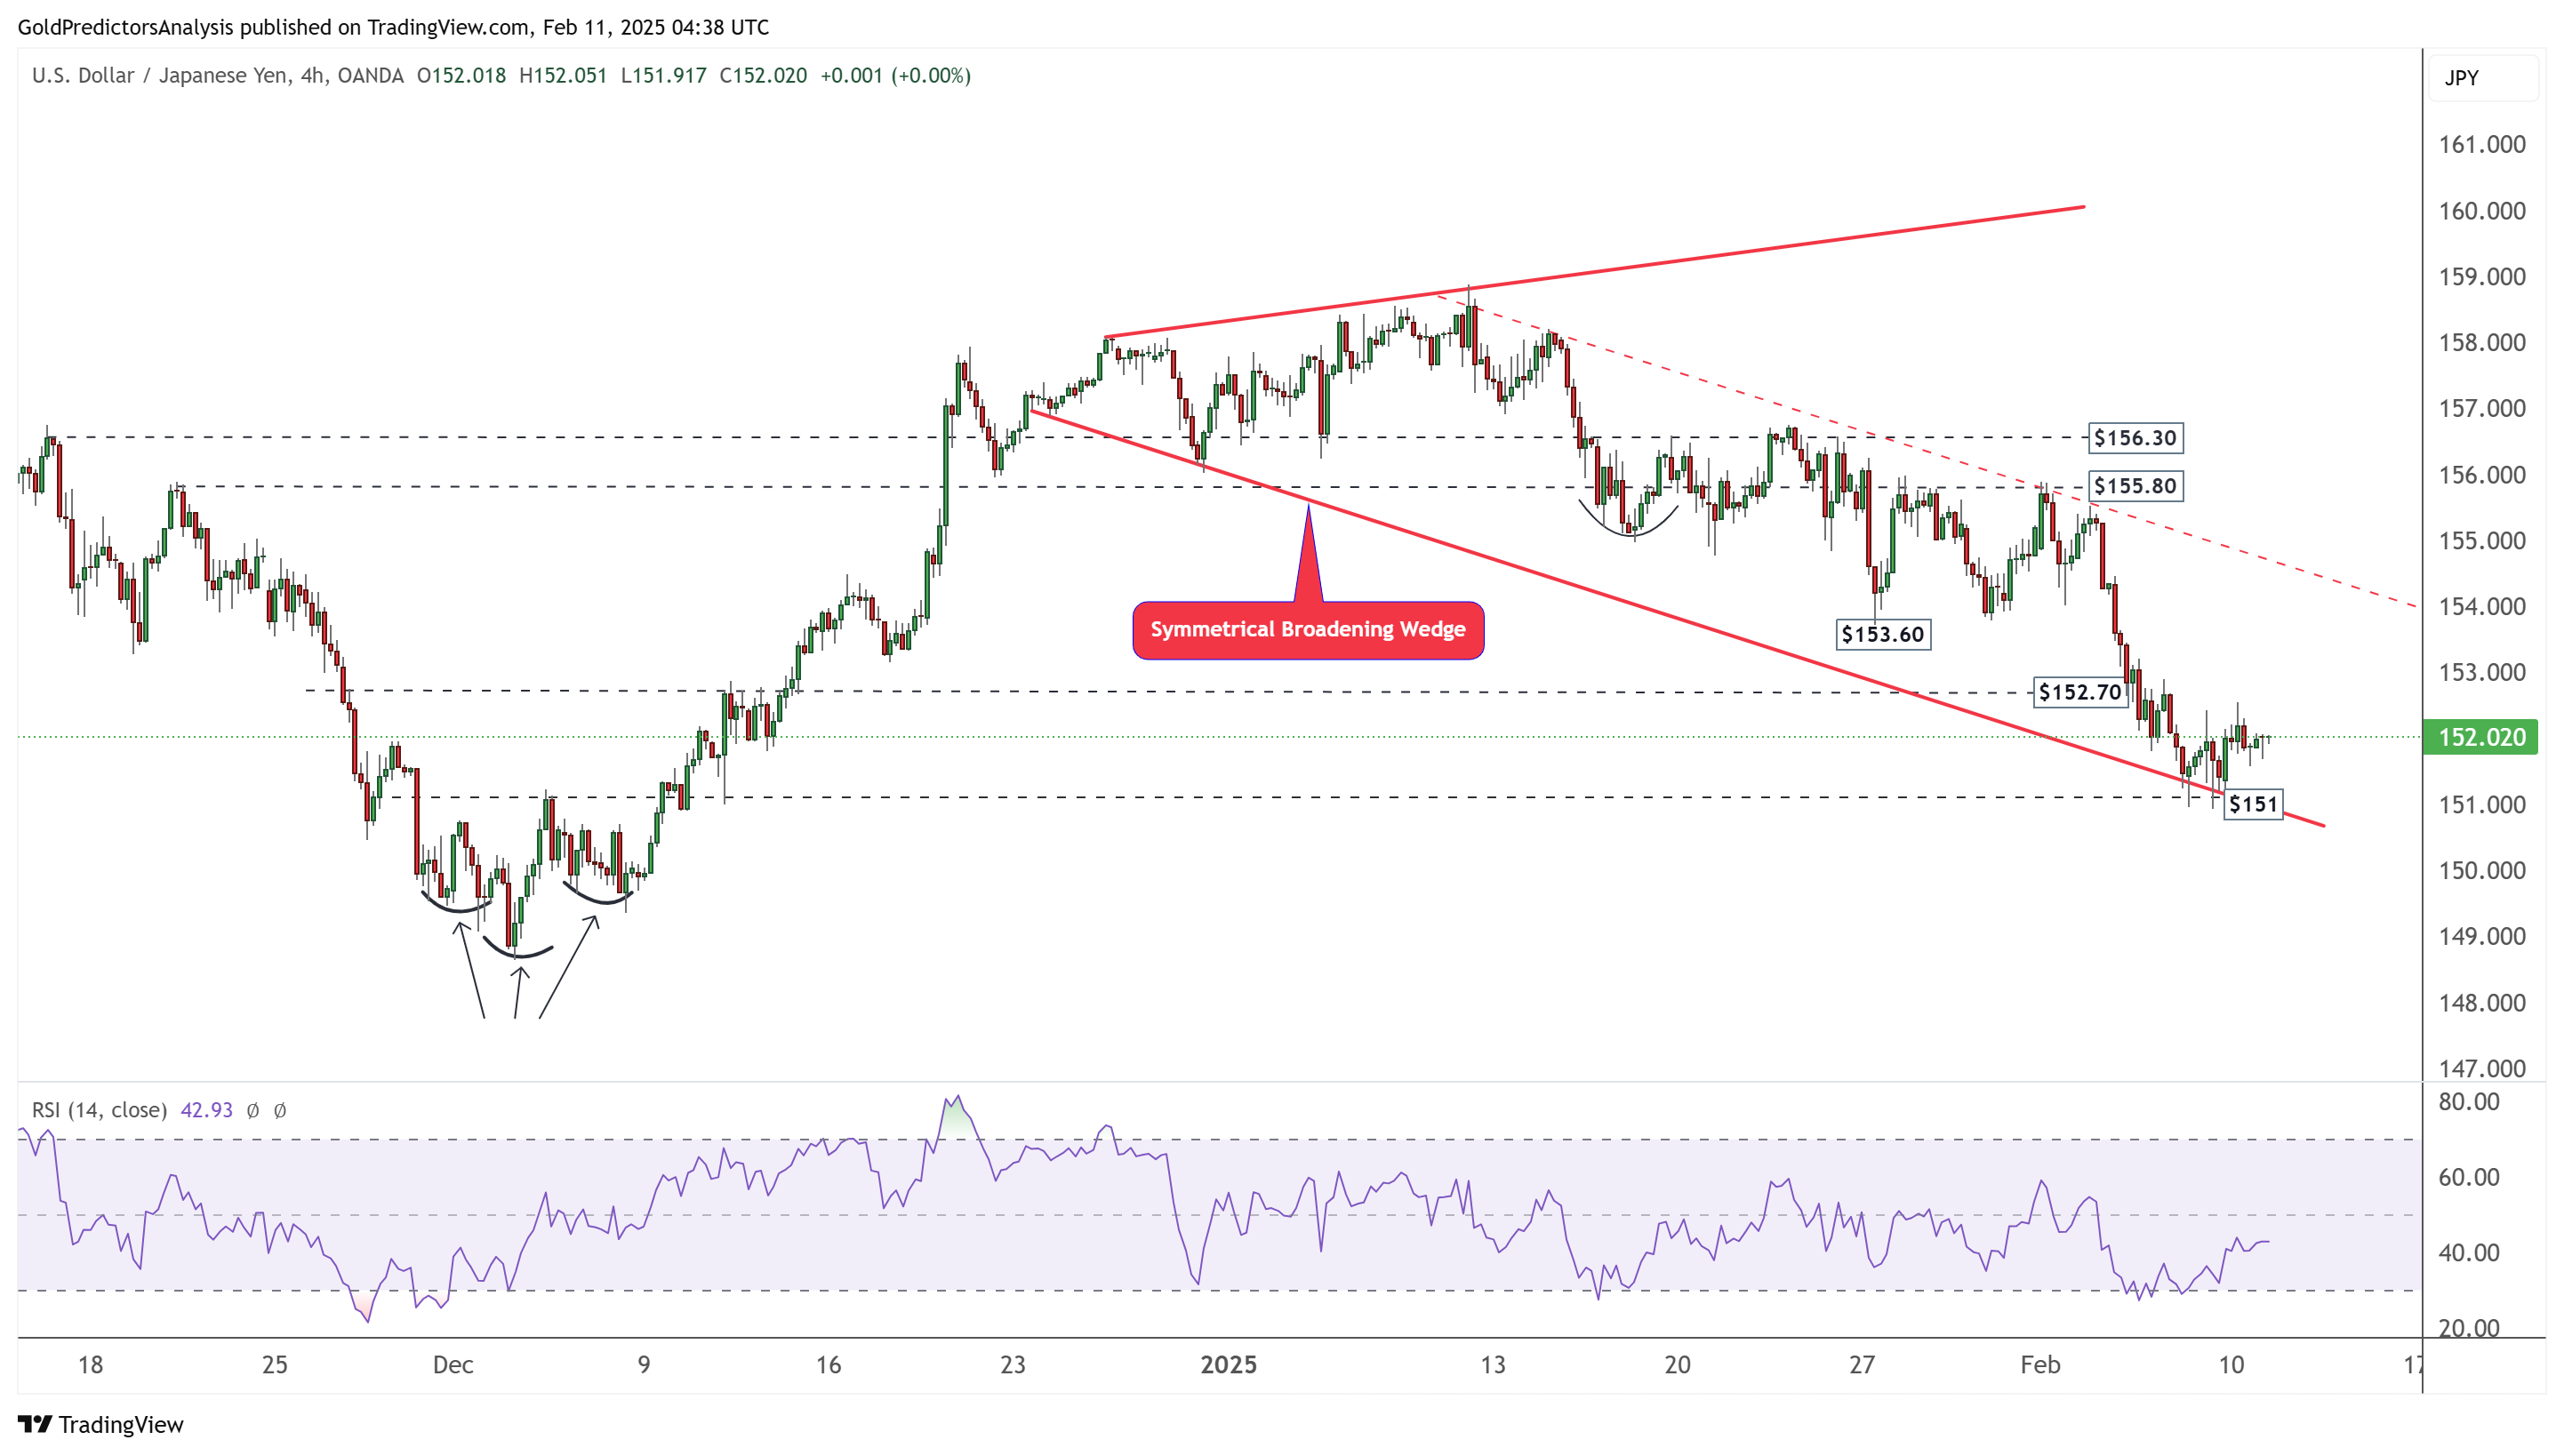
- USD/JPY hits strong support at $151 and looks for a rebound.

AUD/USD Faces Uncertainty as Trade Tensions and RBA Rate Cut Bets Grow
The Australian Dollar (AUD) weakened against the US Dollar (USD) as trade tensions escalated. US President Donald Trump expanded steel and aluminum tariffs by 25%, removing trade exemptions for key allies, including Australia. The White House confirmed that all import tax exclusions had ended and hinted at further tariffs on microchips and vehicles. This policy shift added pressure on AUD/USD, as Australia’s trade relationship with the US faces new uncertainties.
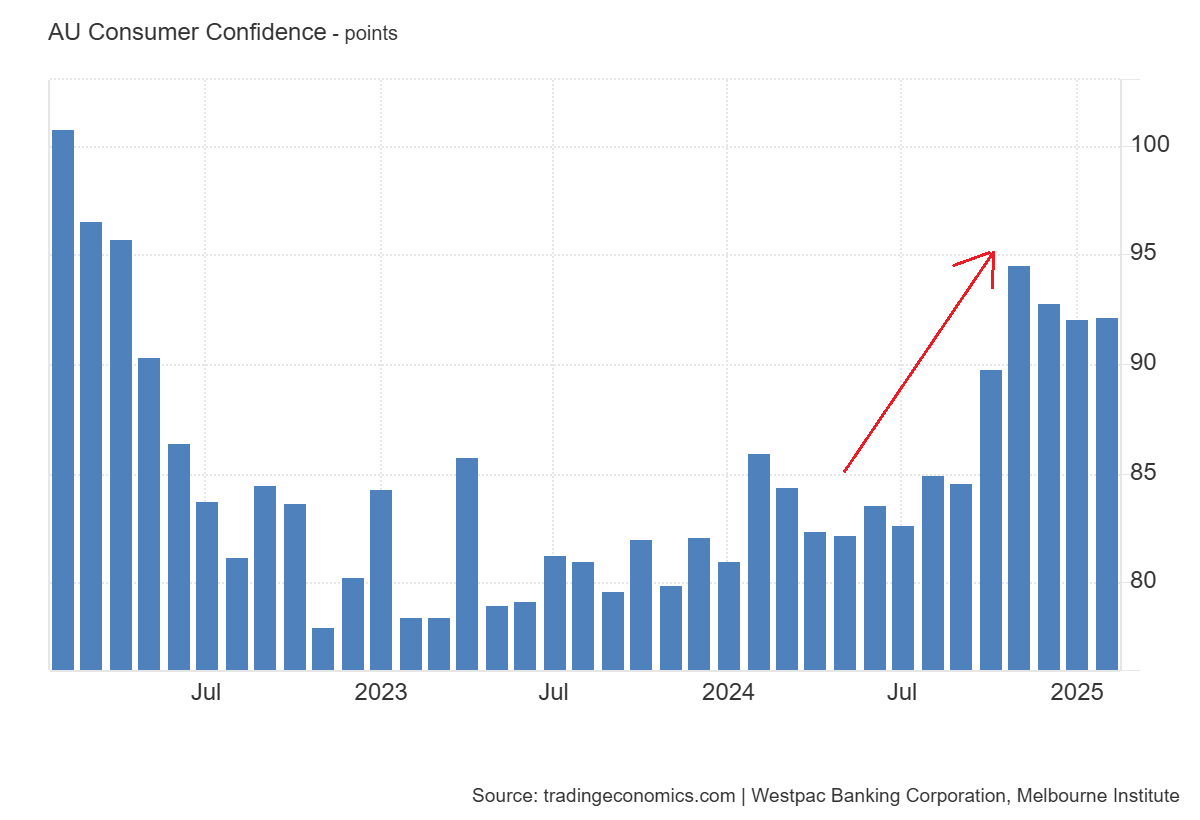
On the other hand, Australia’s Consumer Confidence increased to 92.2 in February. The chart below shows a positive shift in consumer confidence during Q3 and Q4 of 2024. Despite this improvement, economic uncertainties due to unexpected tariffs have triggered a global trade war, impacting the AUD and weakening market sentiment.
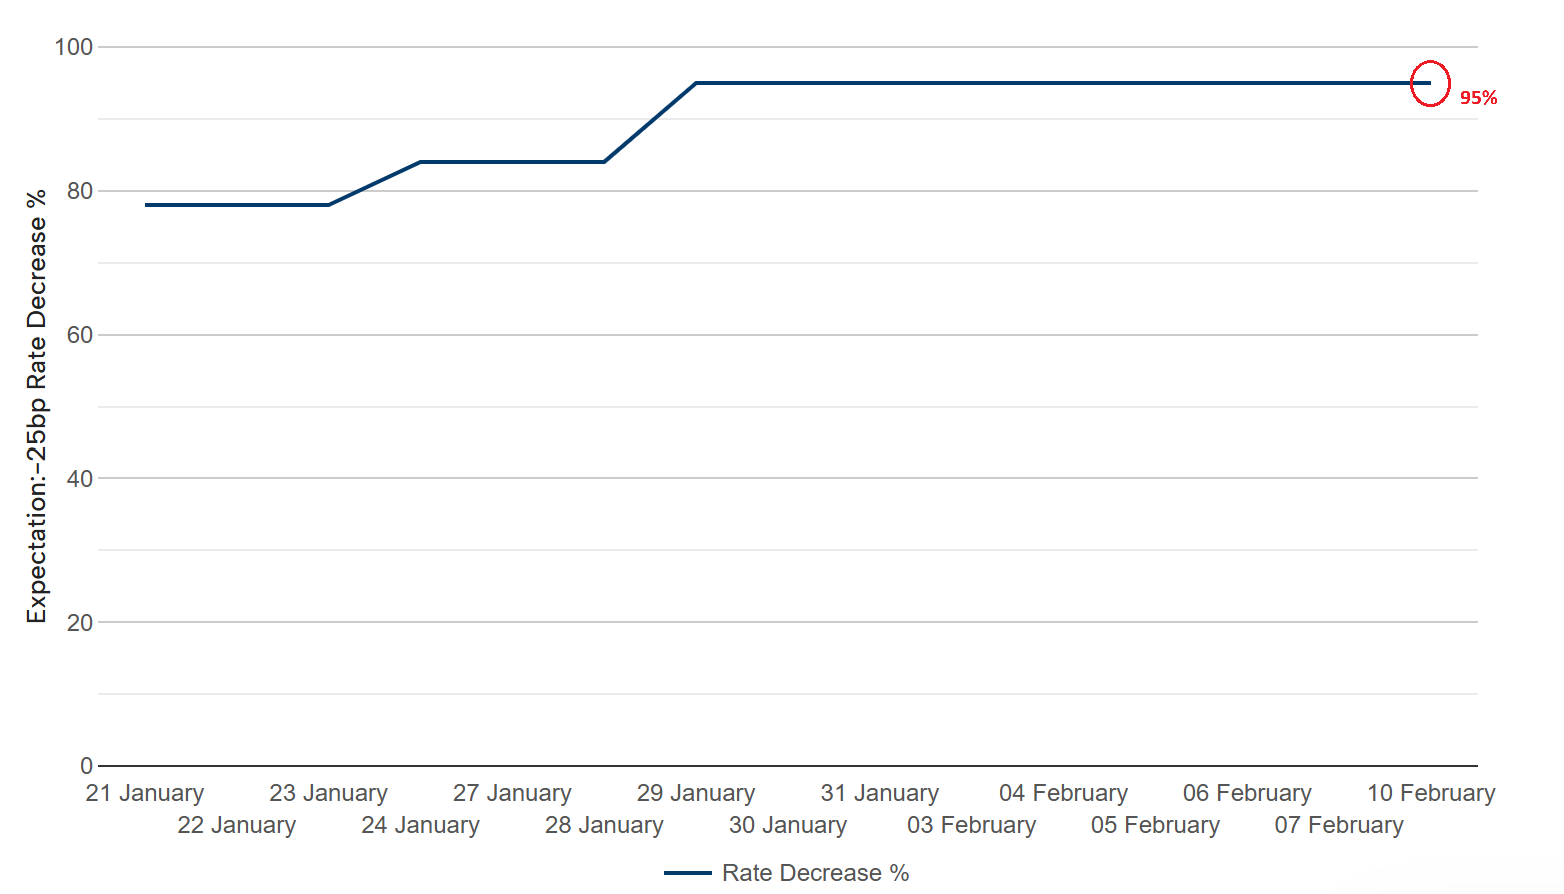
Moreover, the concerns over household finances and rising living costs continue to weigh on consumer spending. Market expectations for a Reserve Bank of Australia (RBA) rate cut in February have risen to 95%, with traders anticipating a reduction from 4.35% to 4.10%, as shown in the chart below. Faster-than-expected disinflation has prompted major Australian banks to move their rate-cut forecasts forward, further weakening the AUD.
However, the Australian Dollar could find support from rising gold (XAU) prices. Gold surged to $2,940 per ounce after the US announced new tariffs. Geopolitical uncertainty has increased financial market volatility, driving demand for gold as a safe-haven asset. If gold prices continue to rise, they could offset some of the bearish pressure on AUD/USD, providing short-term support. Strong consolidation within volatile ranges is possible since AUD/USD remains at long-term support levels.
USD/JPY Volatility Rises Amid Tariff Tensions and Policy Shifts
US President Donald Trump’s decision to impose 25% tariffs on steel and aluminum also impacted the Japanese Yen (JPY), which induced trade war fears. This policy shift threatens Japan’s economic stability and limits the JPY’s upside. However, as a safe-haven asset, the Yen found some support amid rising global uncertainty.
Despite the JPY’s strength, modest USD gains supported USD/JPY. Investors expect Trump’s policies to boost inflation, which could delay Federal Reserve (Fed) rate cuts. The Bank of Japan (BoJ) signaled further interest rate hikes, which helped cushion the Yen’s downside. BoJ Governor Kazuo Ueda and Deputy Governor Himino confirmed the possibility of more hikes if economic conditions align with projections. BoJ board member Naoki Tamura suggested raising rates to 1% in the second half of the fiscal year, reinforcing a hawkish stance.
Traders now focus on Fed Chair Jerome Powell’s testimony and US inflation data. Powell’s comments may influence expectations for future rate cuts and impact the USD/JPY movement. Japan’s core consumer inflation has remained above the BoJ’s 2% target for nearly three years, supporting a stronger JPY. However, concerns that US inflation could rise again may keep the Fed hawkish. The upcoming US consumer inflation report will likely determine the near-term USD trajectory and drive volatility in the USD/JPY pair.
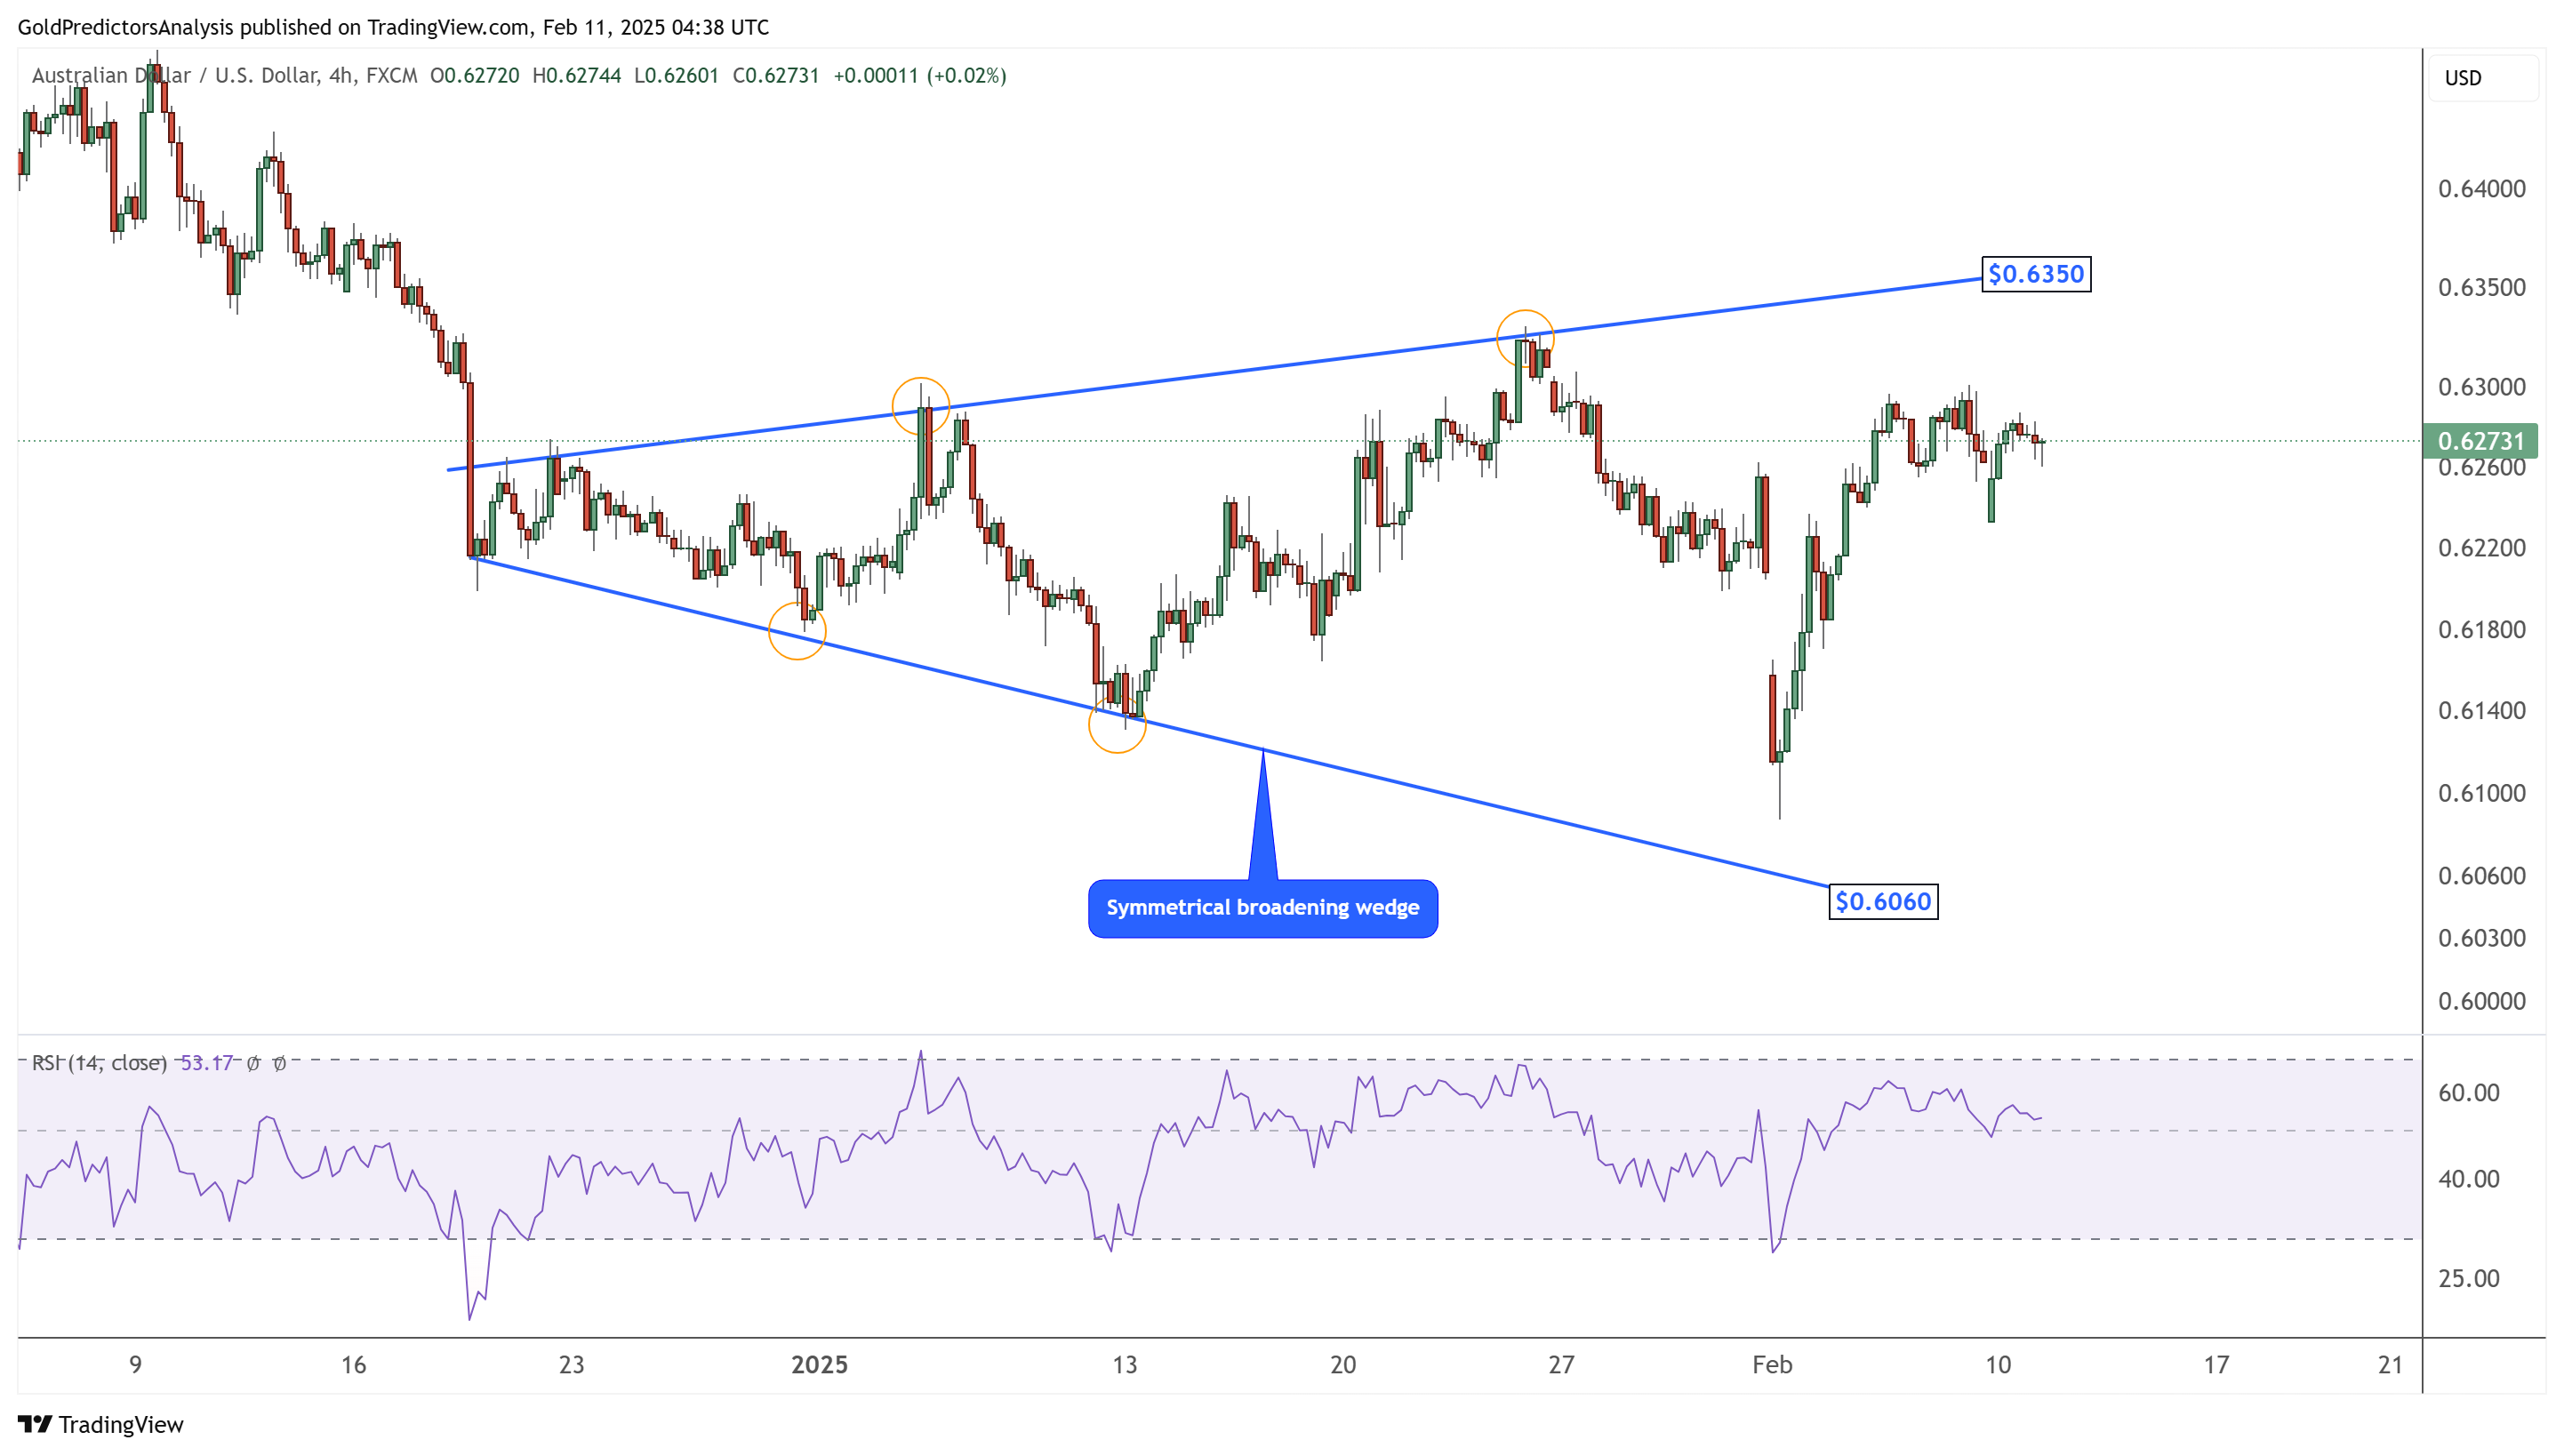
AUD/USD Analysis – Symmetrical Broadening Wedge
The AUD/USD shows strong volatility as the pair trades within a symmetrical broadening wedge pattern. The blue trend lines of this pattern define $0.6060 and $0.6350 as the boundaries of this wide range. A breakout from this range will initiate the next move in AUD/USD. However, consolidation within this range is likely. The new tariffs from the US president may trigger further volatility in AUD/USD.
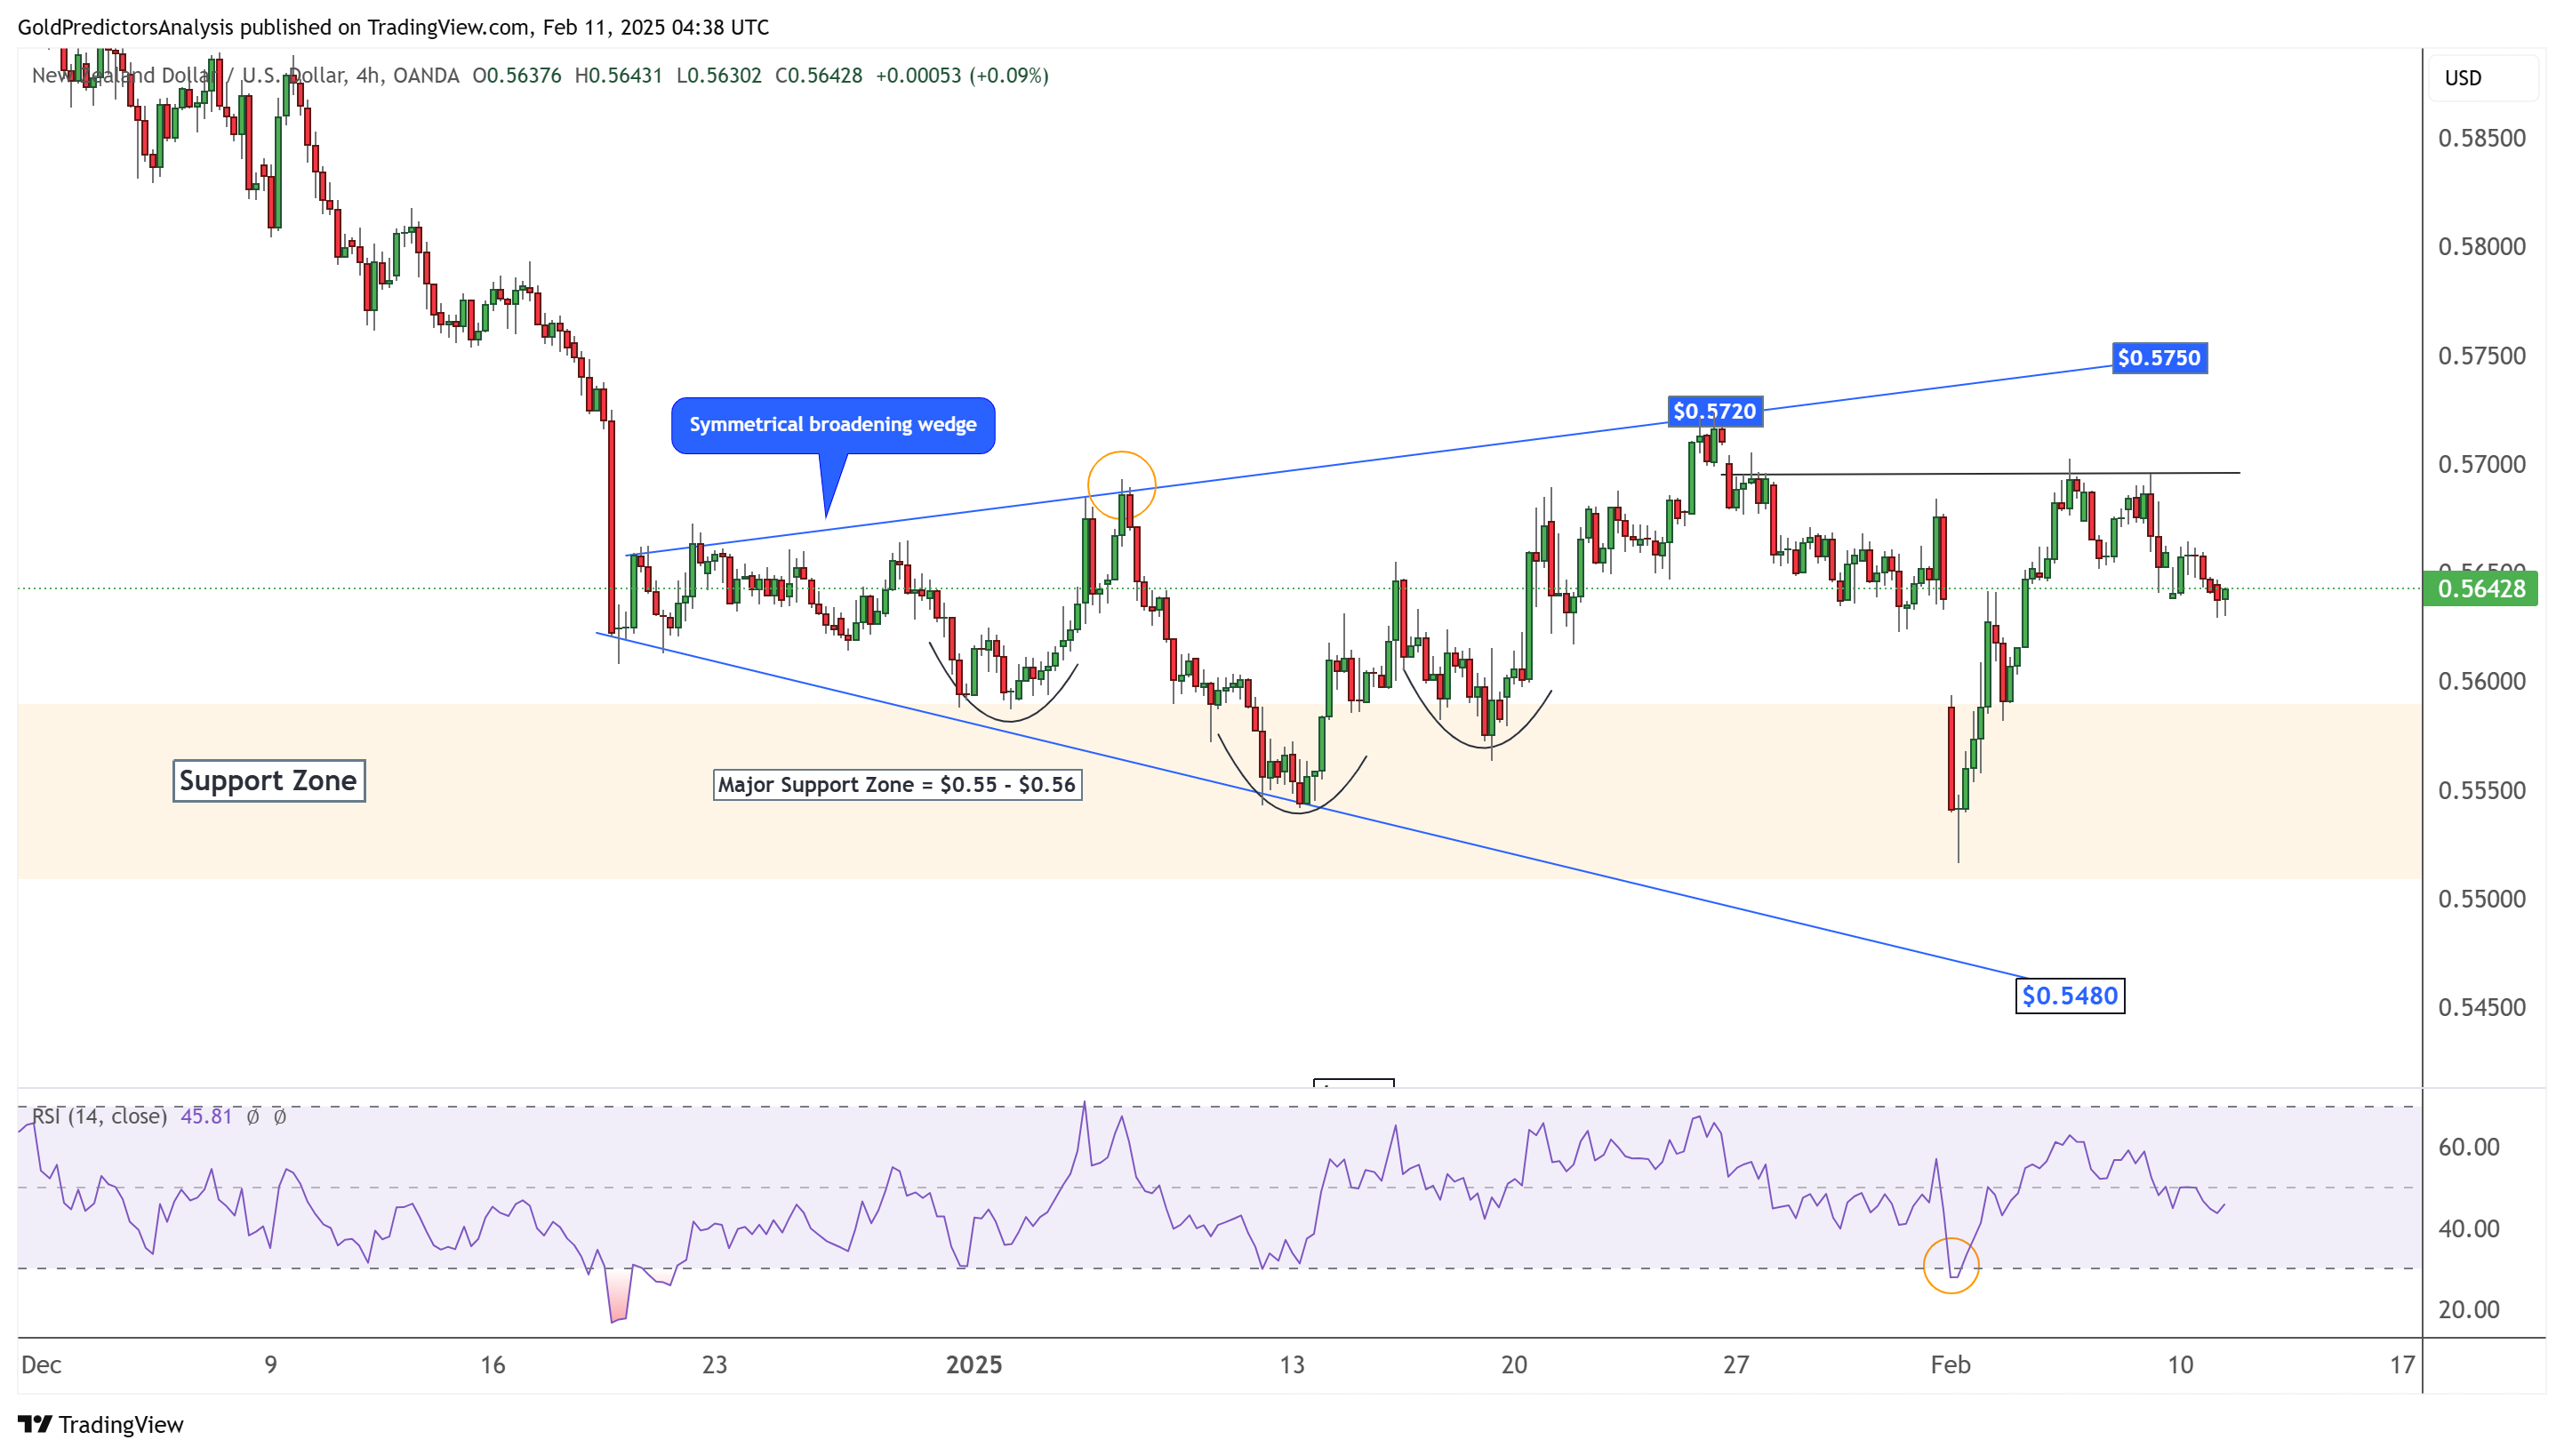
NZD/USD Analysis – Bullish Consolidation
The NZD/USD also consolidates within a similar symmetrical broadening wedge pattern. The black trend line within the wedge shows the formation of bullish price action, as this is acting like the neckline of another inverted head and shoulders. Moreover, the emergence of an inverted head and shoulders pattern in January indicates that the market is building positive momentum around the long-term support area. A push above the $0.5750 level will likely trigger a strong move to the upside.
USD/JPY Analysis – Symmetrical Broadening Wedge
The USD/JPY trades within a symmetrical broadening wedge pattern, with the price reaching the final support at $151. This support aligns with the neckline of the inverted head and shoulders pattern from December 2024. A strong rebound from this level and a break above $155.80 will initiate the next move higher. However, the broadening pattern suggests increased volatility.
About the Author
Bob MasonChief Crypto Boss
TEST 30 He has written extensively for a broader audience and his current focus is on developments relating to the financial markets including, but not limited to currencies, commodities, alternative asset classes, and global equities.
Latest news and analysis


Advertisement