
Advertisement
Advertisement
AUD/USD Elliott Wave: Price Rejected at 2022 Trend Line
By:
Key Points:
- Trend Bias: The AUD/USD pair is in a larger downtrend, in the process of completing a five-wave decline.
- Initial Target: The wave ((iii))) low at .6087.
- Key Level to Watch: Failure to break below .6234 would signal a bullish alternative, especially if the .6408 high is broken.

Current Elliott Wave Analysis
The 4-hour AUD/USD chart indicates the current Elliott wave count is wave ((iv)) topped at .6408 and wave ((v)) is beginning to trend lower.
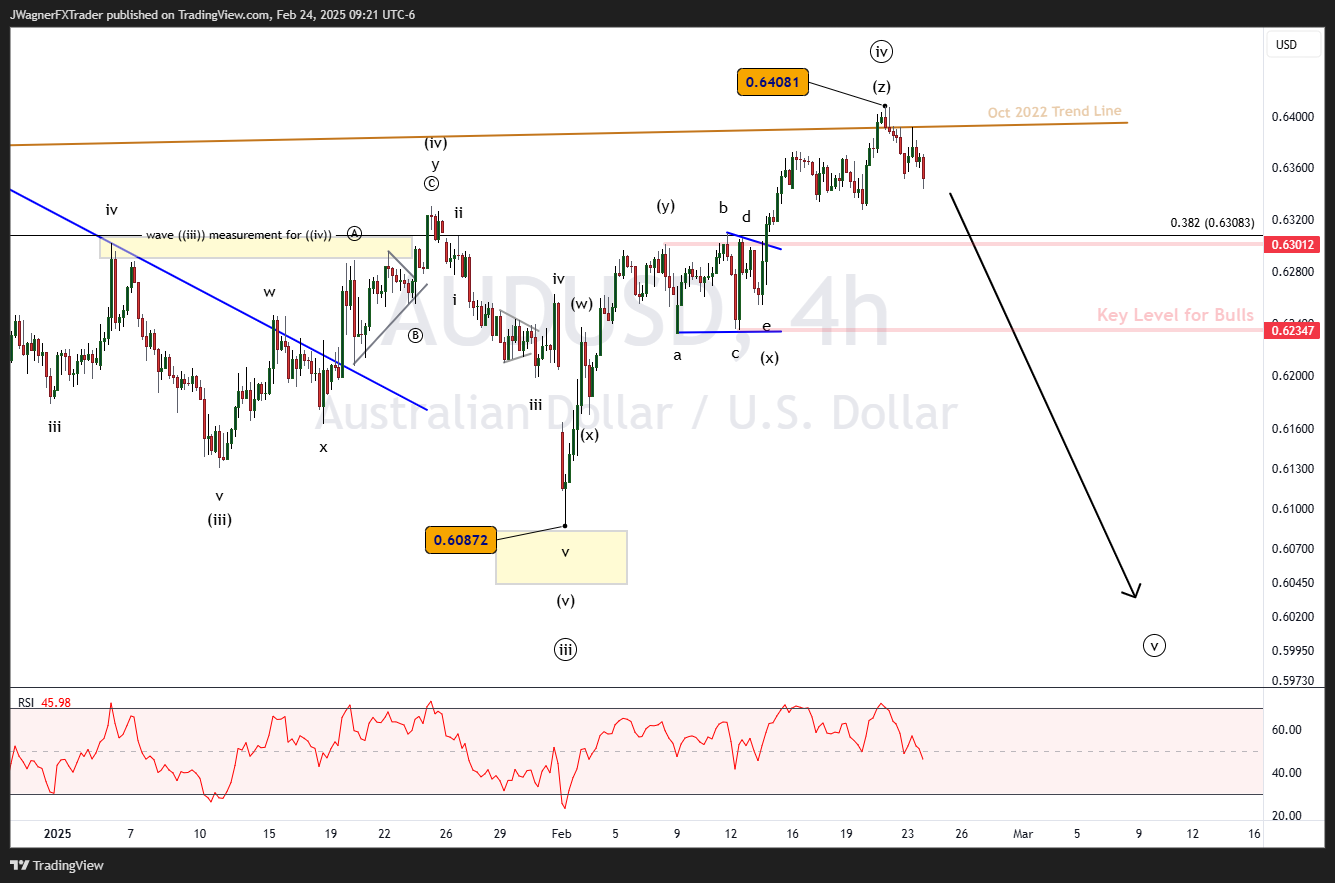
AUD/USD ran into resistance for the wave ((iv)) top as a trend line from October 2022 passed through the same zone. This creates an important high that we are anticipating would hold. But on the other hand, if last week’s high breaks, it could be significant.
Our primary wave count suggests that wave ((v)) is beginning to the downside, an ending wave. Downside targets include .6173 and .6032.
The forecast for AUDUSD is a little at odds with our bullish forecast for EURUSD and GBPUSD. As a result, we are closely monitoring AUDUSD in case the bearish trend does not pan out.
A key level for the decline is .6234 and once it is broken, then the bullish alternative shared below is voided.
Bullish Alternate Wave Count
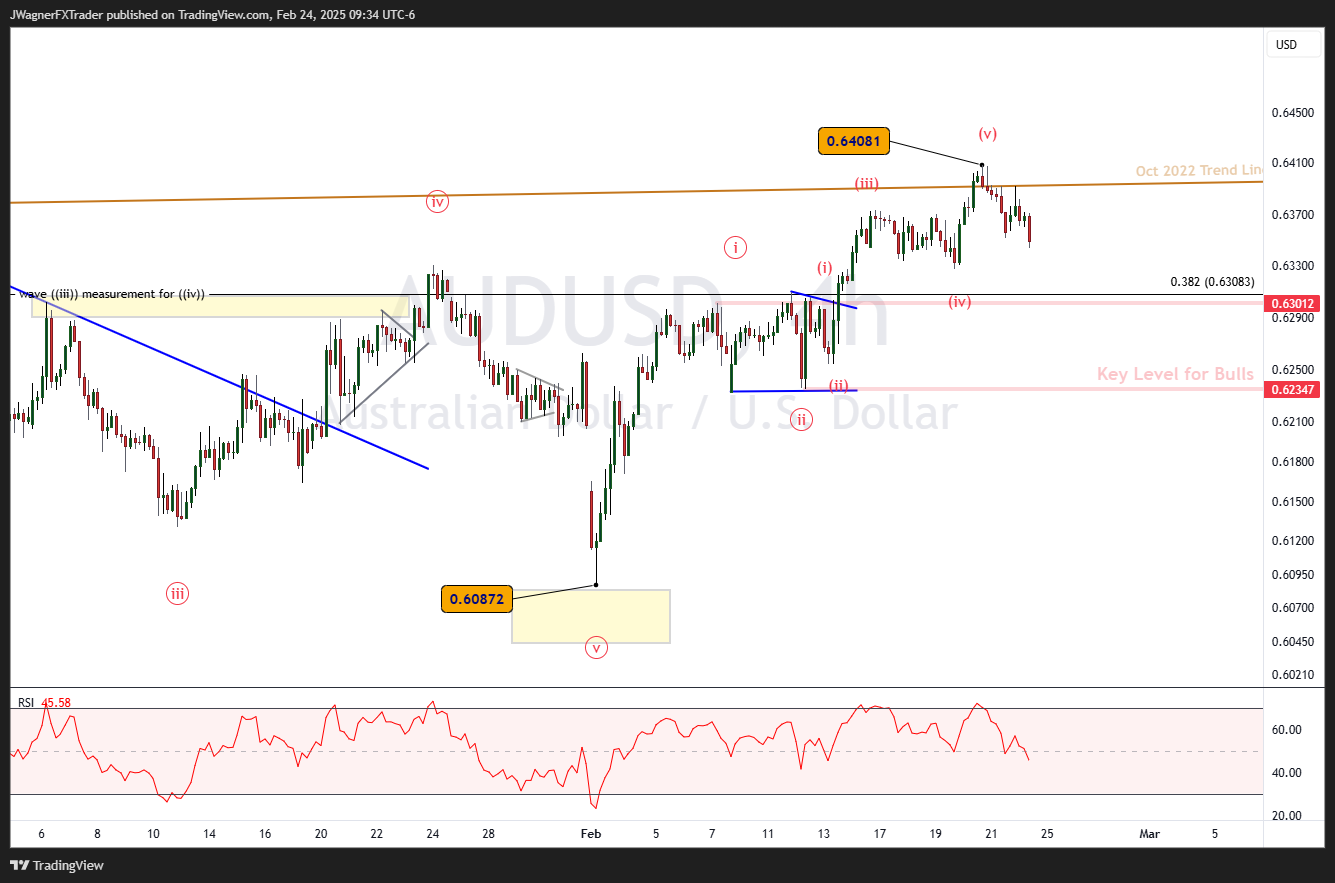
If AUDUSD fails to break below .6234 and starts to pressure last week’s highs, then we’ll elevate the bullish alternative (red labels). In it, the market is unwinding a series of bullish impulse waves that would shoot AUDUSD higher in line with bullish forecasts for EURUSD.
In the event that AUDUSD pressures last week’s high of .6408, a successful breakout likely carries it up to above .6600.
Bottom Line
It appears AUDUSD has an incomplete bearish pattern that needs one more leg lower. Last week’s high pivoted near a trend line dating back to 2022 so the bear count remains the primary view with downside targets near .6173 and .6032.
If AUDUSD cannot push below .6234, then we’ll consider a bullish alternative that could drive AUDUSD up to .6600.
Key Levels for Bearish Bias: Must hold below .6408 and break .6234
Initial Target: .6173
Secondary Target: .6032
About the Author
Bob MasonChief Crypto Boss
TEST 30 He has written extensively for a broader audience and his current focus is on developments relating to the financial markets including, but not limited to currencies, commodities, alternative asset classes, and global equities.
Latest news and analysis


Advertisement