
Advertisement
Advertisement
Natural Gas, WTI Oil, Brent Oil Forecasts – Oil Rebounds As U.S. Imposes New Sanctions On Iran
By:
Key Points:
- Natural gas pulled back due to bearish changes in weather forecasts.
- WTI oil found strong support near the $70.00 level.
- Brent oil moved towards the $75.00 level as traders reacted to new sanctions on Iran.

Natural Gas
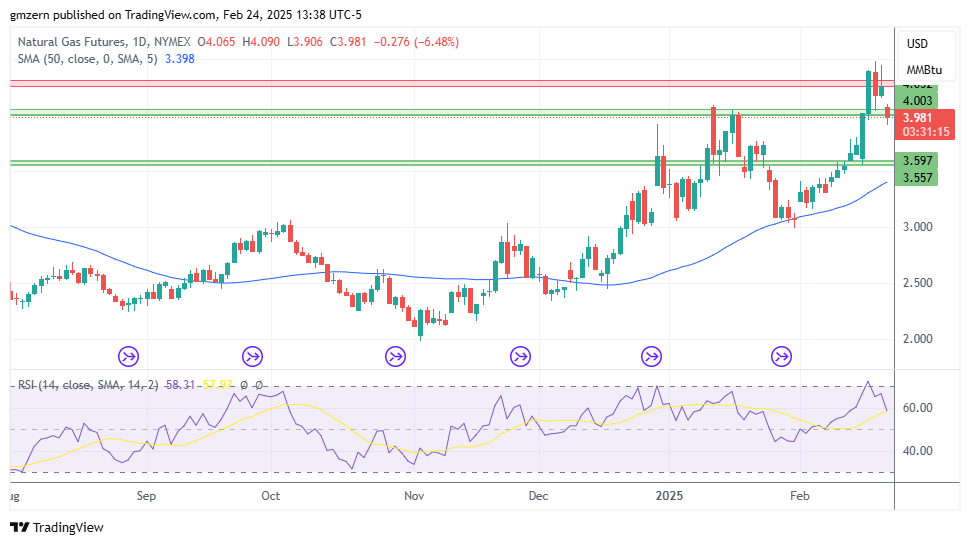
Natural gas pulls back as traders focus on bearish changes in weather forecasts, which indicate that demand could be weaker in early March.
In case natural gas settles below the support at $4.00 – $4.05, it will head towards the next support level, which is located in the $3.55 – $3.60 range.
WTI Oil
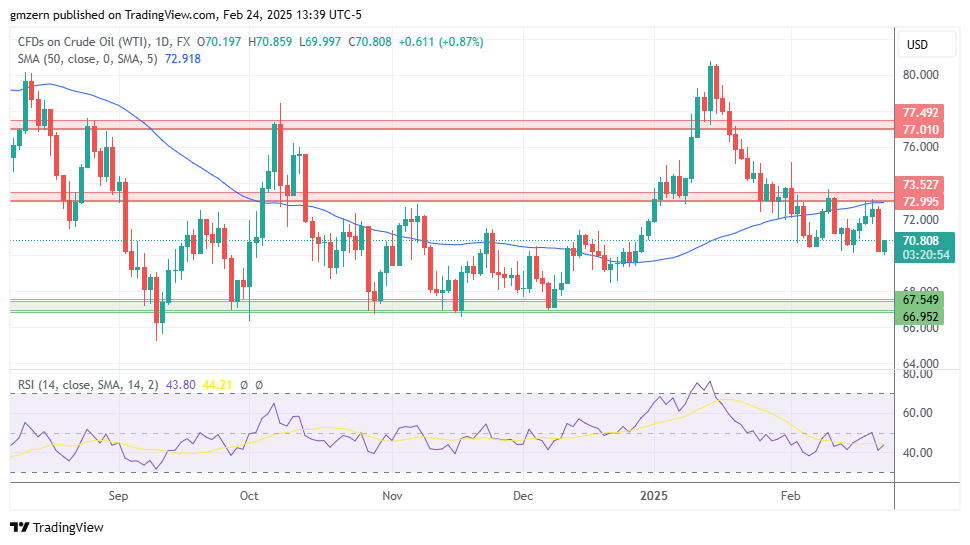
WTI oil is moving higher as traders focus on the new round of U.S. sanctions against Iran.
A move above the $71.00 level will open the way to the test of the resistance at $73.00 – $73.50.
Brent Oil
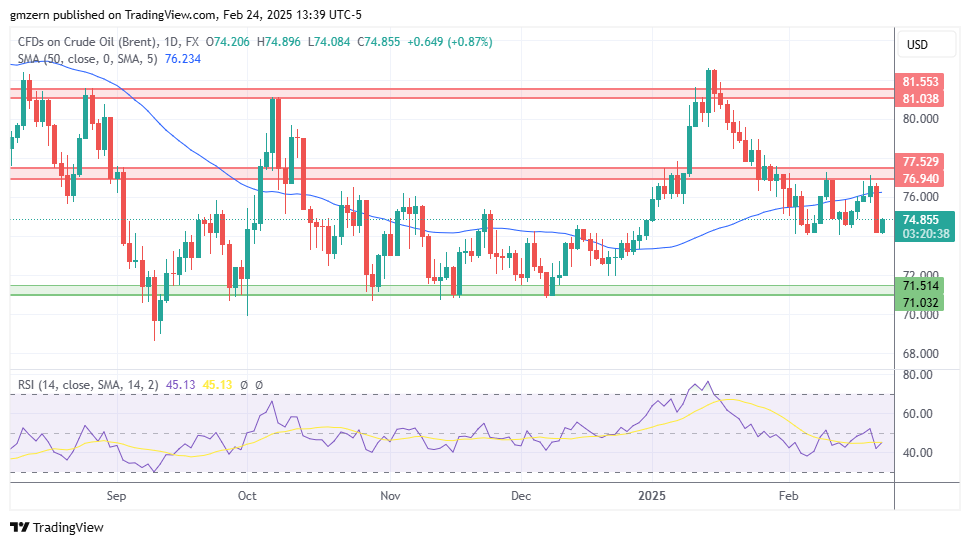
Brent oil has also moved higher in today’s trading session as some traders were ready to buy the dip.
In case Brent oil settles back above the $75.00 level, it will head towards the resistance level at $77.00 – $77.50.
For a look at all of today’s economic events, check out our economic calendar.
About the Author
Vladimir Zernovauthor
In more than 15 years of trading in the financial markets, Vladimir dealt with a wide range of brokers and financial instruments. His career as a day-trader at a proprietary trading firm goes back to 2007. Later, Vladimir turned to longer time frames and became an independent trader and analyst managing his own portfolio. Using his experience, he helps traders find the best broker in his reviews.
Latest news and analysis


Advertisement