
Advertisement
Advertisement
Natural Gas Price Forecast: Pulls Back After Rally, Faces Key Support Levels
By:
Natural gas retreated from recent highs, testing Fibonacci support at $3.91. A deeper correction could emerge if key levels like $3.55 are breached.
Resistance was seen in natural gas around the recent $4.48 trend high reached last week. However, on Monday, natural gas could no longer retain strength and challenge the resistance zone. Instead, it triggered a bearish decline falling below last Fridays inside day pattern before finding support at the day’s low of $3.91 and bouncing.
Support was seen at the confluence of two Fibonacci retracement levels. Both a 38.2% Fibonacci retracement of the full swing during the recent advance, and a 61.8% Fibonacci retracement of an interim upswing that is contained within the full uptrend pattern. In other words, it would mark the potential minimum anticipated bearish correction.
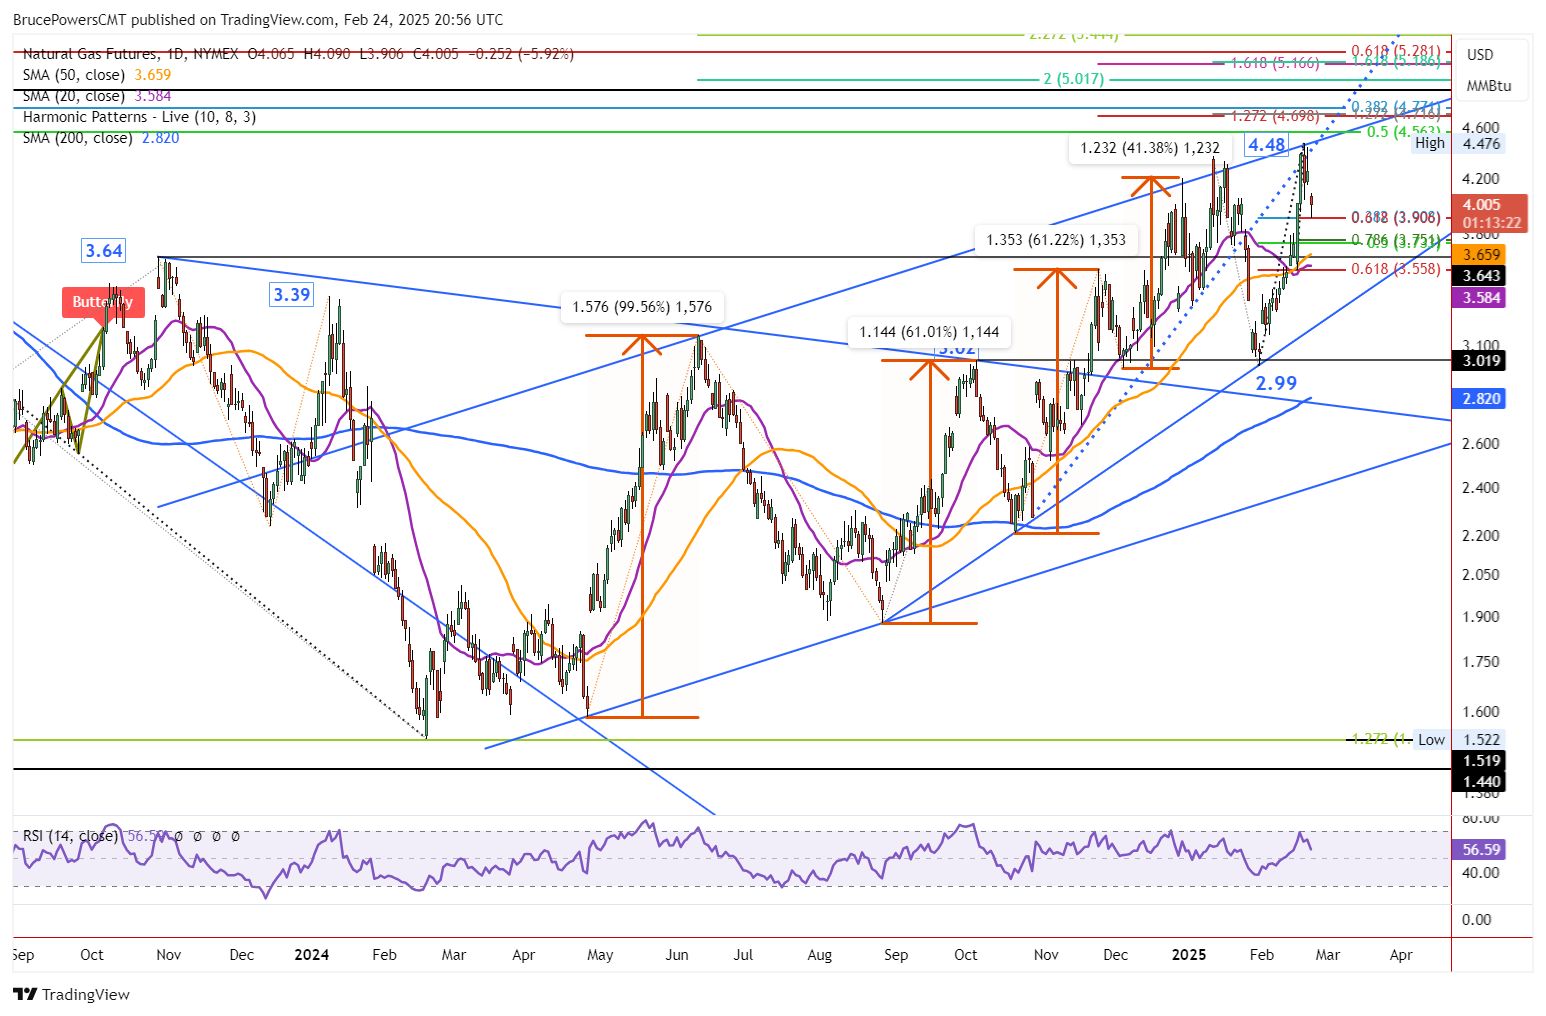
38.2% Fibonacci Retracement Completed
Although Monday’s low completes what could be a minimum pullback for the developing uptrend, it wouldn’t be surprising to see a deeper pullback or consolidation before the bull trend is ready to resume. Notice the recent accelerated advance following a test of support at the 50-Day MA on February 18.
This is bullish behavior, but it also indicates that the price of natural gas may have gone too far too fast and may need a rest. Resistance from the advance was seen around a top trendline of a rising parallel trend channel. The line was recently recognized by the market several times in January when it represented resistance. Also, notice that an earlier rising trendline (dotted) converges with the channel line around recent highs.
Lower Price Support Levels
Despite support being seen today at $3.91, a decisive decline below today’s low will trigger a likely continuation of the bearish retracement. The next lower potential support zone is then around $3.75 to $3.73, consisting of a 78.6% retracement and a 50% retracement level, respectively. Further down is the 50-Day MA at $3.66 and the 20-Day MA at $3.58.
Each represents a potential support level, and those price levels should be considered within a price zone that includes the 61.8% Fibonacci retracement at $3.56. It is also important to realize that there is a weekly low from last week at $3.55. Therefore, a drop below that price level will violate the developing weekly bullish pattern of higher weekly highs and higher weekly lows.
For a look at all of today’s economic events, check out our economic calendar.
About the Author
Bruce Powerscontributor
Bruce has been involved in the financial markets for over 20 years, as an analyst, trader, educator, and writer.
Latest news and analysis


Advertisement