
Advertisement
Advertisement
Bitcoin (BTC) Climbs Despite ETF Outflows as US Recession Fears Ease
By:
Key Points:
- Bitcoin (BTC) gained 1.15% on June 7, supported by easing US recession fears and Friday’s upbeat jobs data.
- Weekly BTC-spot ETF outflows totaled $131.6M, with FBTC seeing a significant investor pullback.
- BTC price hinges on Fed rate path, US-China trade, ETF flows, and Capitol Hill’s Bitcoin Act progress.

ETF Outflows Persist Despite BTC Rebound
Bitcoin (BTC) rose 1.15% on Saturday, June 7, building on Friday’s 2.72% gain to close at $105,576. Notably, BTC trailed the broader crypto market, which advanced 1.38% to a total market cap of $3.25 trillion.
Friday’s US Jobs Report eased fears of a US recession, bolstering demand for risk assets going into the weekend. According to Polymarket, the chances of a 2025 recession fell to 26% on June 8, down from 30% on June 6.
However, US BTC-spot ETF market weekly outflows capped gains. According to data from Farside investors, BTC-spot ETF issuers posted net outflows of $131.6 million in the week ending June 6, after outflows of $144.8 million in the previous week. Notable weekly flows included:
- Fidelity Wise Origin Bitcoin Fund (FBTC) had net outflows of $167.7 million.
- Grayscale Bitcoin Trust (GBTC) reported net outflows of $40.6 million.
- ARK 21Shares Bitcoin ETF (ARKB) saw net outflows of $24.5 million.
- Meanwhile, BlackRock’s (BLK) iShares Bitcoin Trust (IBIT) had net inflows of $81.1 million, while VanEck Bitcoin ETF (HODL) saw net inflows of $19.7 million.
Despite net outflows of $130.5 million on June 6, IBIT retained its dominant market position after seeing net inflows of $5,914.9 million in May.
Market sentiment toward the President Trump-Elon Musk feud likely contributed to weekly outflows. Market intelligence platform Santiment commented:
“Generally, when major crypto personalities see spikes in discussion rate, the chances of market reversals increase.”
BTC-spot ETF market flows remain crucial for BTC’s supply-demand trends and price trajectory. Strong inflows in May drove BTC to a record high of $111,917 on May 22.
BTC Price Outlook: Key Drivers
BTC’s near-term price outlook hinges on several key macro and market drivers:
- US-China trade headlines will influence risk sentiment and broader crypto market demand.
- Legislative developments, including the Bitcoin Act’s progress on Capitol Hill.
- US inflation data could influence the Fed rate path.
- US BTC-spot ETF flows remain crucial to near-term price trends.
BTC Price Scenarios:
- Bullish Scenario: Easing trade tensions, dovish Fed cues, bipartisan support for crypto bills, and strong ETF inflows may drive BTC toward $111,917.
- Bearish Scenario: Renewed trade tensions, hawkish Fed signals, legislative setbacks, or ETF outflows could drag BTC below $100,000.
For ongoing insights into macro trends, regulation, and ETF data, follow our analysis here.
Technical Analysis
Bitcoin Analysis
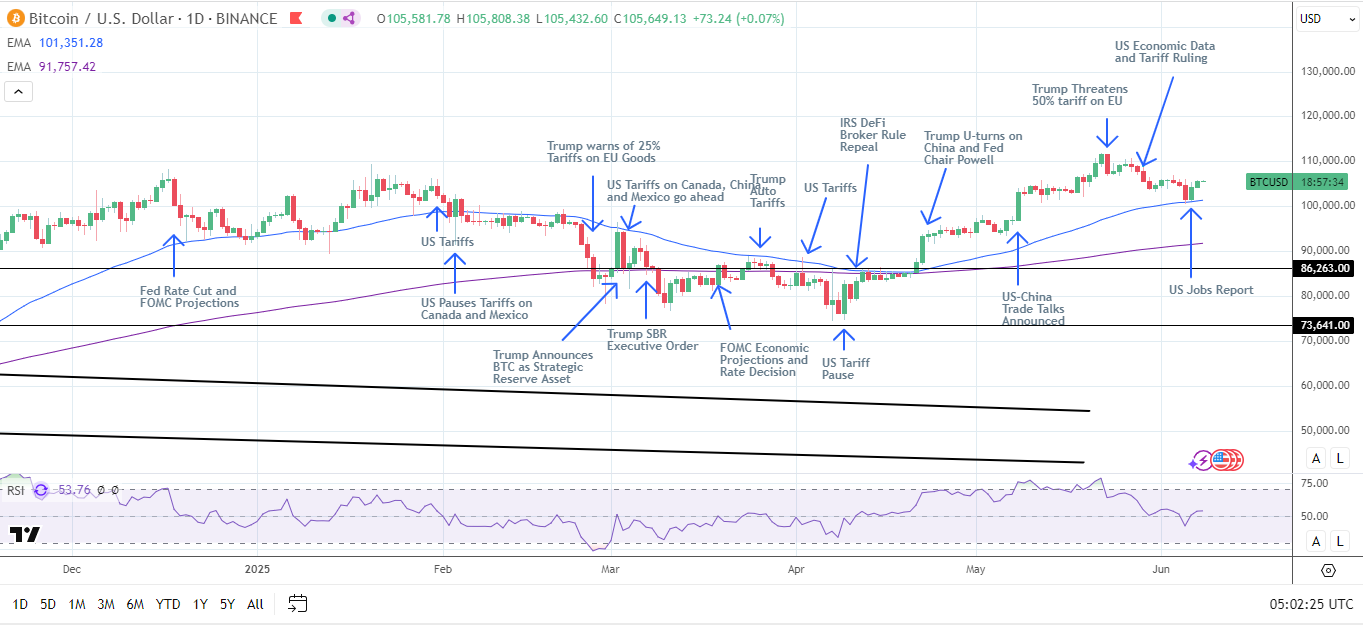
BTC trades above its 50-day and 200-day Exponential Moving Averages (EMA), signaling bullish momentum.
- Upside Target: A breakout from $105,000 could open the door to testing resistance at the record high of $111,917. A sustained move above $111,917 may bring $115,000 into sight.
- Downside Risk: A drop below the 50-day EMA and $100,000 could expose BTC to $95,000 and potentially the 200-day EMA.
The 14-day Relative Strength Index (RSI) at 53.76 suggests BTC has room to rally to $111,917 before entering overbought territory (RSI > 70).
Stay ahead of market trends by accessing real-time BTC price data and technical indicators here.
Ethereum Analysis
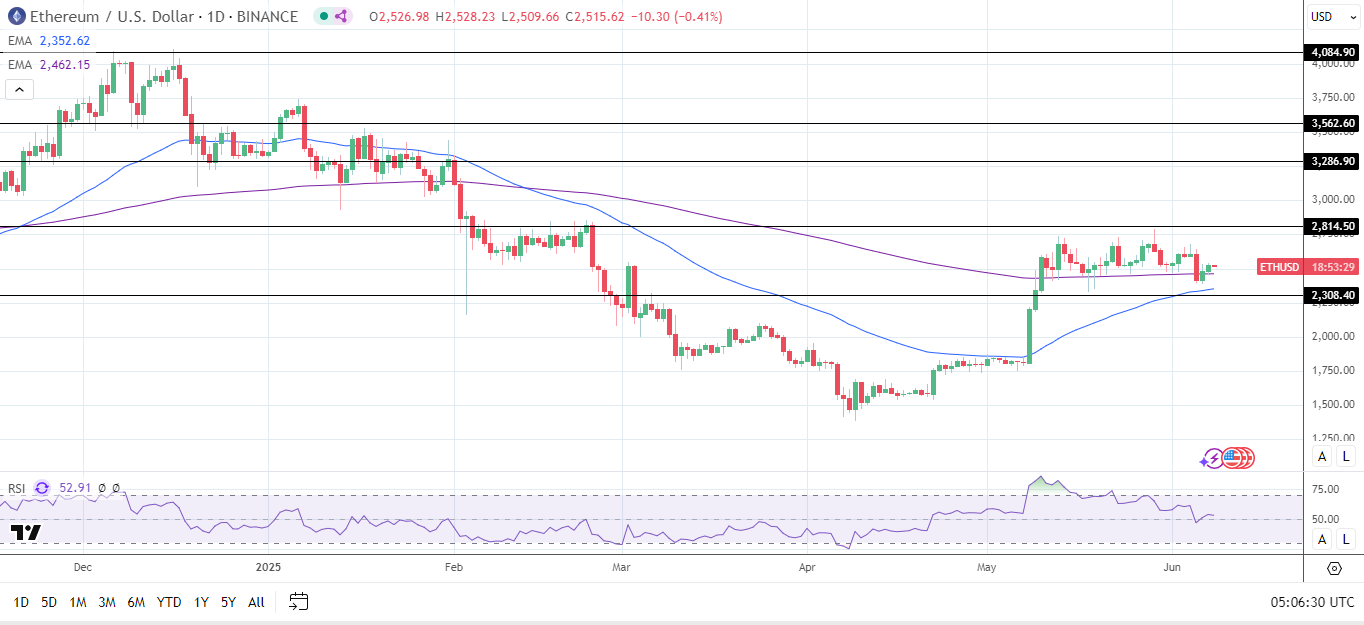
Turning to ethereum (ETH), ETH trades above the 50-day and 200-day EMAs after two positive sessions, affirming bullish momentum.
Fifteen consecutive days of net inflows into the US ETH-spot ETF market contributed to ETH gains on June 6 and 7.
- Upside target: A breakout above the June 4 high of $2,680 could enable the bulls to target the $2,815 resistance level. A sustained move through $2,815 could bring $3,000 into play.
- Downside risks: If ETH drops below the 200-day EMA, the 50-day EMA and the $2,308 support level would be the next key support levels.
The 14-day Relative Strength Index (RSI) at 52.91 suggests ETH could climb to $3,000 before entering overbought territory (RSI > 70).
Stay informed on BTC and ETH trends by tracking macroeconomic developments, ETF flows, and technical indicators here.
About the Author
Bob MasonChief Crypto Boss
123456789 30 He has written extensively for a broader audience and his current focus is on developments relating to the financial markets including, but not limited to currencies, commodities, alternative asset classes, and global equities.


Advertisement