
Advertisement
Advertisement
Bitcoin (BTC) News Today: BTC at Sub-$67K Amid ETF Outflows and Fed Uncertainty
By:
Key Points:
- Bitcoin (BTC) gained 0.20% on Saturday (June 15), closing the session at $66,244.
- US BTC-spot ETF total weekly net outflows left BTC at sub-$67,000 for the first time since May 16.
- On Sunday (June 16), investors will likely look ahead to another pivotal week for the crypto market, with US stats and SEC vs. crypto case-related news in focus.

In this article:
BTC Hovers at Sub-$70,000 as Investors Consider the Week Ahead
On Saturday (June 15), bitcoin (BTC) gained 0.20%. Partially reversing a 1.01% loss from Friday (June 14), BTC closed the session at $66,244. Significantly, BTC fell short of the $67,000 handle for the first time since May 16.
US BTC-spot ETF market weekly outflows from the week ending June 14 limited the upside. The US BTC-spot ETF market ended a five-week net inflow streak, with total weekly net outflows of $580.6 million.
Uncertainty about the Fed rate path influenced buyer demand for BTC-spot ETFs, impacting BTC price trends.
On Sunday (June 16), investors should consider another pivotal week ahead for the crypto market. US economic indicators, including retail sales (Tues), jobless claims (Thurs), and S&P Global Services PMI (Fri) numbers, will likely influence the Fed interest rate trajectory.
Better-than-expected numbers could reduce investor bets on a September Fed rate cut and impact buyer demand for US BTC-spot ETFs.
Furthermore, SEC vs. crypto case-related updates also need consideration. Investors await a court ruling on the Coinbase (COIN) Motion for Interlocutory Appeal.
If the court grants the motion, Coinbase can appeal against the court denying, in large part, its Motion to Dismiss (MTD). In August 2023, Coinbase filed its Motion to Dismiss, arguing the SEC lacked the statutory authority to regulate US crypto exchanges.
Updates from the ongoing SEC vs. Ripple case also warrant attention. Court filings suggest a court verdict could come in the summer.
The SEC considers BTC a commodity. However, favorable outcomes to SEC vs. crypto cases could drive buyer demand for BTC and the broader crypto market. Court rulings could pave the way for a more transparent crypto regulatory landscape.
Market sentiment toward the prospects of a US ETH-spot ETF market improved on Saturday. ETH advanced by 2.54% on Saturday, ending the session at $3,568.
SEC Approvals for US ETH-Spot ETF Drive Buyer Demand for ETH
On Friday (June 14), Bloomberg Intelligence Senior ETF Analyst Eric Balchunas delivered a positive outlook for US ETH-spot ETFs, saying,
“UPDATE: we are moving up our over/under date for the launch of spot Ether ETF to July 2nd, hearing the Staff sent issuers comments on S-1s today, and they’re pretty light, nothing major, asking for them back in a week. Decent chance they work to declare them effective the next week and get it off their plate bf holiday wknd. Anything poss but this is our best guess as of now.”
The Bloomberg Intelligence Senior ETF analyst brought the approval day forward from July 4. Balchunas also said the ETFs normally go live one day after the SEC approves the S-1 forms.
Technical Analysis
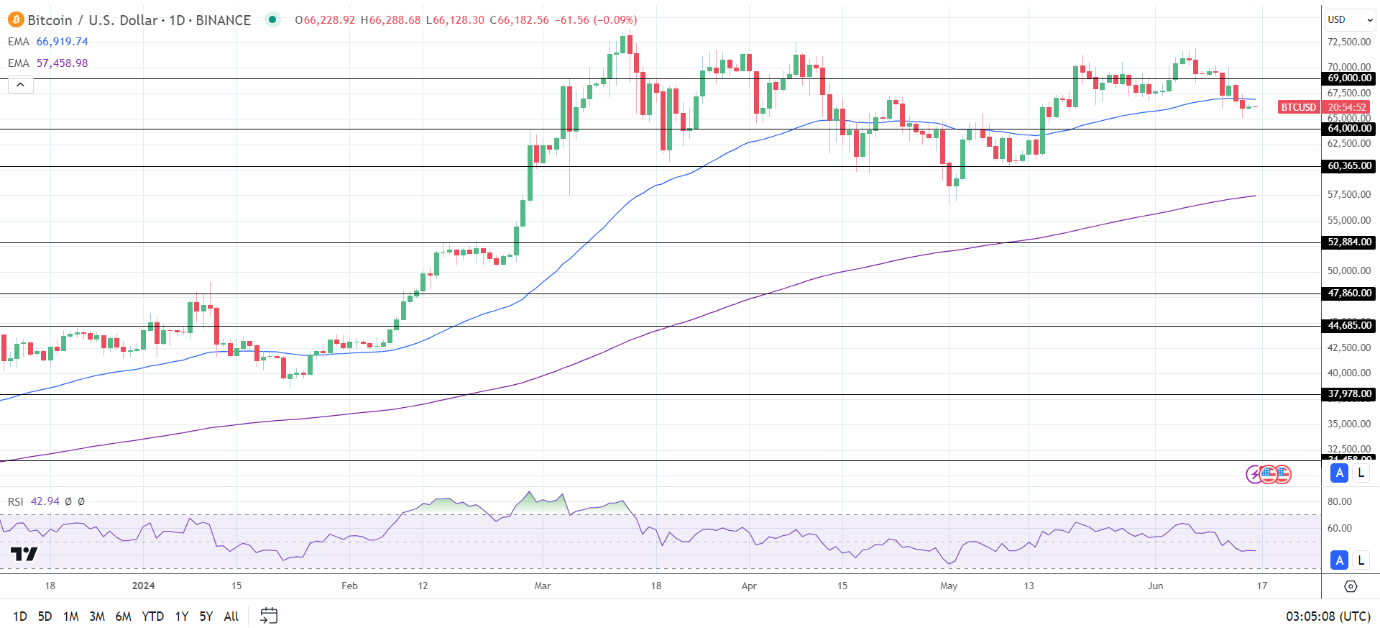
Bitcoin Analysis
BTC remained below the 50-day EMA while holding above the 200-day EMA, confirming bearish near-term but bullish longer-term price trends.
A BTC break above the 50-day EMA could give the bulls a run at the $69,000 resistance level. A breakout from the $69,000 resistance level could bring the $73,808 all-time high into play.
SEC activity, SEC vs. crypto case-related chatter, and sentiment toward the Fed rate path require consideration.
Conversely, a BTC fall through $65,000 could signal a drop below the $64,000 support level.
With a 42.94 14-Daily RSI reading, BTC could drop below the $64,000 support level before entering oversold territory.
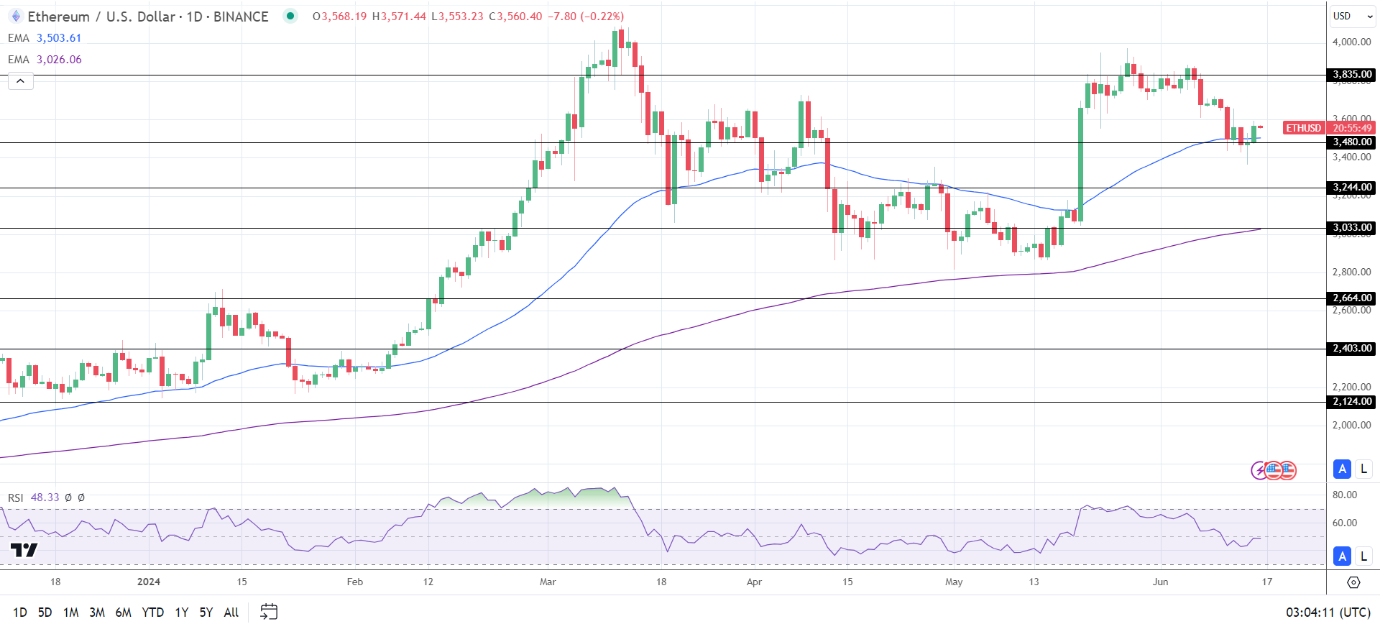
Ethereum Analysis
ETH sat above the 50-day and 200-day EMAs, sending bullish price signals.
An ETH return to the $3,600 handle would support a move to the $3,835 resistance level.
US ETH-spot ETF-related updates also need consideration.
Conversely, an ETH break below the 50-day EMA and the $3,480 support level could signal a drop toward the $3,244 support level.
The 14-period Daily RSI reading, 48.33, suggests an ETH fall to the $3,244 support level before entering oversold territory.
About the Author
Bob MasonChief Crypto Boss
TEST 30 He has written extensively for a broader audience and his current focus is on developments relating to the financial markets including, but not limited to currencies, commodities, alternative asset classes, and global equities.
Did you find this article useful?
Latest news and analysis


Advertisement