
Advertisement
Advertisement
Bitcoin (BTC) News Today: Trump’s Crypto Endorsements and Fed Speculation
By:
Key Points:
- Bitcoin (BTC) gained 0.56% on Sunday (June 16), closing the session at $66,614.
- Uncertainty about the September Fed interest rate cut left BTC below $67,000 for the second time since May 16.
- On Monday (June 17), Fed commentary, SEC activity, and US BTC-spot ETF market flow trends need consideration.

In this article:
BTC in Limbo Amid Mixed Fed Rate Cut Signals
On Sunday (June 16), bitcoin (BTC) gained 0.56%. Following a 0.20% gain on Saturday (June 15), BTC ended the week down 4.40% at $66,614. Significantly, BTC fell short of the $67,000 handle for the second time since May 16.
Uncertainty about a September Fed rate cut continued influencing buyer demand for BTC.
Recent US inflation and consumer sentiment figures raised investor bets on a September Fed rate cut. According to the CME FedWatch Tool, the chances of the Fed standing pat in September tumbled from 49.5% to 29.8% in the week ending June 14.
However, the market outlook was more dovish than the FOMC Economic Projections. The Fed raised its Fed Funds Rate projection to 5.1% and its core PCE inflation forecast to 2.6% for 2024. An FFR projection of 5.1% reduces 2024 Fed rate cuts from three to one.
While the Nasdaq Composite Index advanced by 3.24% in the week ending June 14, the US BTC-spot ETF market saw total weekly net outflows of $580.6 million. Notably, the US BTC-spot ETF market ended a five-week net inflow streak, while the Nasdaq Composite Index had a five-day winning streak.
US Republican Party Front-Runner Donald Trump Talked Crypto
BTC enjoyed a positive weekend despite the uncertainty about a September Fed rate cut.
MicroStrategy (MSTR) founder and Chairman Michael Saylor shared a Donald Trump speech over the weekend, with Trump drumming up the crypto vote, saying,
“We will ensure that the future of crypto and the future of bitcoin will be made in America. We’re going to keep it right here, and a lot of it’s going to be done right here in Florida.”
The Republican Party front-runner has targeted the 50 million plus Americans holding crypto. A Republican Party victory in the US Presidential Election would end the SEC reign of regulation through enforcement and likely introduce a more crypto-friendly SEC Chair.
A crypto-friendly regulatory framework that protects retail investors could lure more investors into the crypto space.
While BTC remains the crypto market barometer, ETH-spot ETF-related chatter warrants investor attention.
On Saturday (June 15), ETF Store President Nate Geraci had this to say about an ETH-spot ETF market,
“And once again, for the record, I think people are underestimating potential eth ETF demand…
.”
Technical Analysis
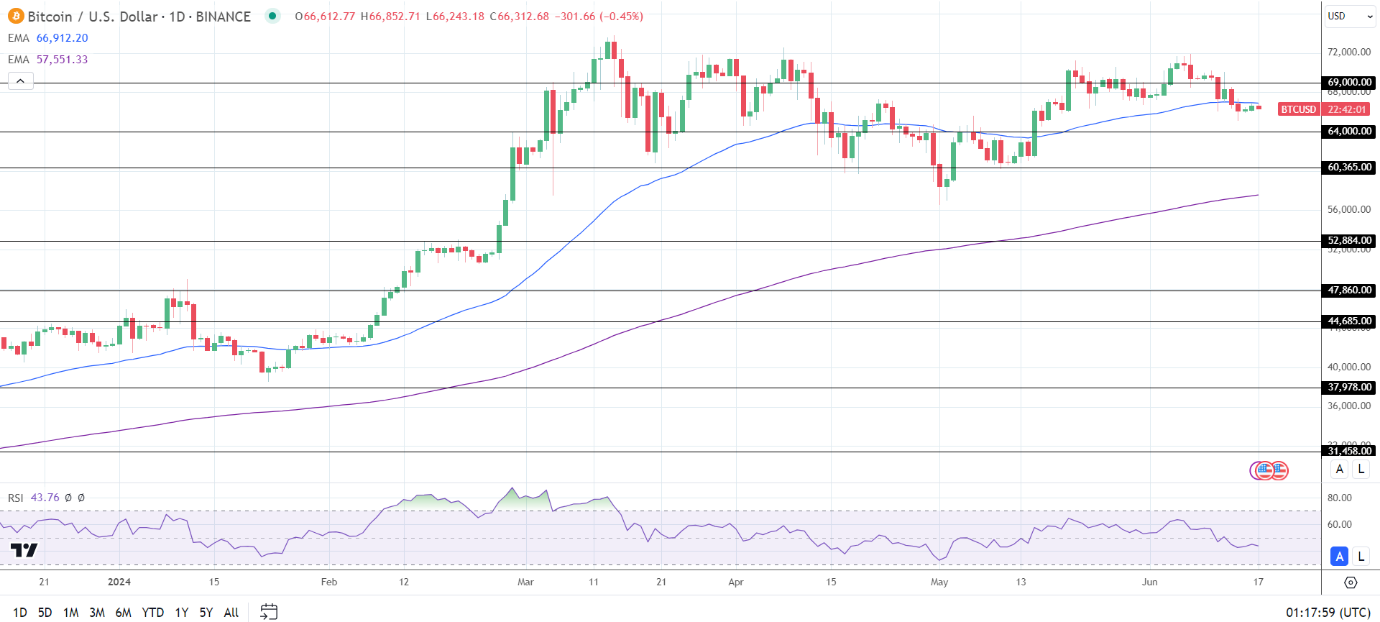
Bitcoin Analysis
BTC hovered below the 50-day EMA while remaining above the 200-day EMA, affirming the bearish near-term but bullish longer-term price signals.
A BTC breakout from the 50-day EMA could signal a move to the $69,000 resistance level. A break above the $69,000 resistance level could give the bulls a run at the $73,808 all-time high.
SEC activity, FOMC Member chatter, and sentiment toward the Fed rate path require consideration.
Conversely, a BTC break below $65,000 could give the bears a run at the $64,000 support level.
With a 43.76 14-Daily RSI reading, BTC could fall through the $64,000 support level before entering oversold territory.
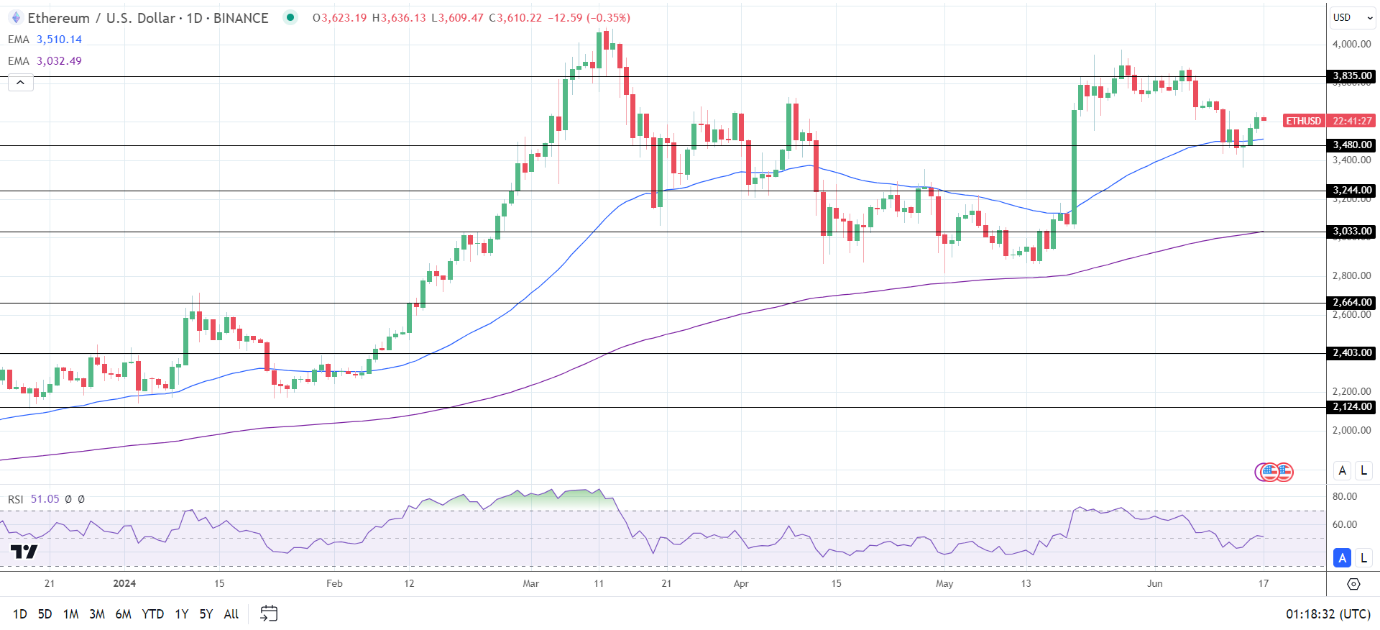
Ethereum Analysis
ETH remained above the 50-day and 200-day EMAs, affirming the bullish price signals.
An ETH break above the $3,750 handle could give the bulls a run at the $3,835 resistance level.
US ETH-spot ETF-related updates also need consideration.
Conversely, an ETH fall through the 50-day EMA and the $3,480 support level would bring the $3,244 support level into play.
The 14-period Daily RSI reading, 51.05, indicates an ETH break above the $3,835 resistance level before entering overbought territory.
About the Author
Bob MasonChief Crypto Boss
TEST 30 He has written extensively for a broader audience and his current focus is on developments relating to the financial markets including, but not limited to currencies, commodities, alternative asset classes, and global equities.
Did you find this article useful?
Latest news and analysis


Advertisement