
Advertisement
Advertisement
Bitcoin (BTC) Outlook: Bullish as Blackrock’s Spot ETF Inflows Extend for Fifth Week
By:
Key Points:
- Bitcoin (BTC) held above $100K for the ninth day despite losses, supported by strong BTC-spot ETF inflows.
- BTC-spot ETFs saw $608.4M in net inflows for the week ending May 16, led by BlackRock’s $841.7M surge.
- US-China trade truce boosted risk appetite, helping crypto and stocks rally, with Nasdaq up 7.15% on the week.

BTC-Spot ETF Inflows Keep Bitcoin Above $100,000
Bitcoin (BTC) slipped 0.3% on Saturday, May 17, adding to Friday’s 0.26% loss to close at $103,236. Despite a second consecutive daily loss, BTC held above $100,000 for a ninth session.
A US-China trade war truce drove demand for risk assets, with the Nasdaq Composite Index ending the week up 7.15%.
BTC rallied to a May 12 high of $105,756 before retreating amid uncertainties surrounding the GENIUS Act. However, US BTC-spot ETF market inflows cushioned the downside, holding BTC above $100,000.
According to Farside investors, BTC-spot ETF issuers recorded total net inflows of $608.4 million in the week ending May 16. BlackRock’s (BLK) iShares Bitcoin Trust (IBIT) dominated, with net inflows of $841.7 million. Meanwhile, Fidelity Wise Origin Bitcoin Fund (FBTC) had net outflows of $122.2 million.
Notably, the US BTC-spot ETF market extended its inflow streak to five weeks.
ETF Store President Nate Geraci remarked on IBIT’s flows, stating:
“iShares Bitcoin ETF now w/ inflows 22 of past 23 days… $6+bil new $$$. This is legit inst’l & wealth management $$$ being allocated IMO. No view on price, but still think extremely early in mainstream “tradfi” adoption. Like top of the 1st inning. Maybe 2nd.”
The ongoing deployment of longer-term capital into BTC-spot ETFs could further support BTC price gains.
BTC Price Outlook: Key Drivers
BTC’s short-term price outlook hinges on several key macro and market drivers:
- US-China trade headlines will likely influence risk sentiment and broader crypto market trends.
- The GENIUS Act vote could dictate sentiment toward the Bitcoin Act and the supply-demand trajectory.
- US economic data may influence Fed rate cut bets and recession risk.
- US BTC-spot ETF flows remain crucial to near-term price trends.
BTC Price Scenarios:
- Bullish Scenario: Easing trade tensions, dovish Fed bets, passing of the GENIUS Act, Bitcoin Act momentum, and strong ETF inflows may drive BTC toward $110,000.
- Bearish Scenario: Renewed trade tensions, hawkish Fed signals, legislative gridlock, or ETF outflows could drag BTC toward $90,000.
For ongoing insights into macro trends, regulation, and ETF data, follow our analysis here.
Technical Analysis
Bitcoin Analysis
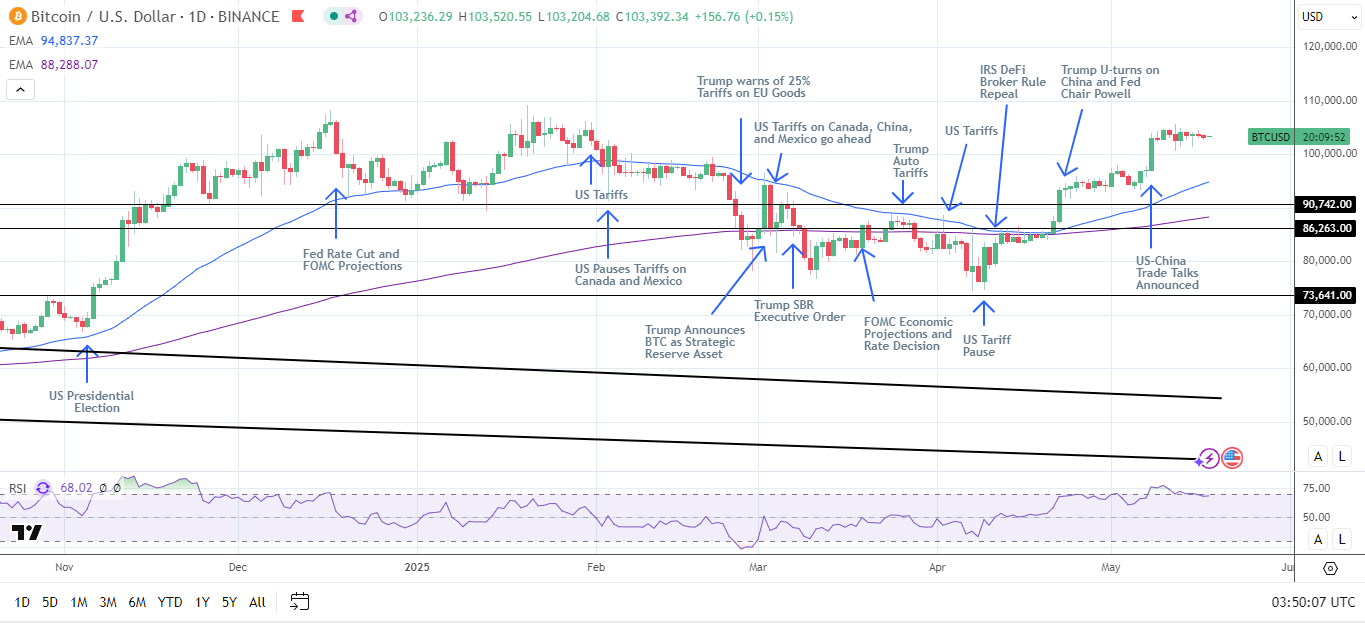
BTC remains above the 50-day and the 200-day Exponential Moving Averages (EMA), reaffirming bullish momentum.
- Upside Target: A break above the May 12 high of $105,756 could pave the way to the record high of $109,312. A decisive move beyond $109,312 may bring $115,000 into view.
- Downside Risk: A drop below $100,000 could send BTC toward the 50-day EMA. Increasing selling pressure may expose the $90,742 support level.
The 14-day Relative Strength Index (RSI) at 68.02 shows BTC has room to climb to $109,312 before entering overbought territory (RSI > 70).
Stay ahead of market trends by accessing real-time BTC price data and technical indicators here.
Ethereum Analysis
Turning to ethereum (ETH), ETH benefited from improving market risk sentiment.
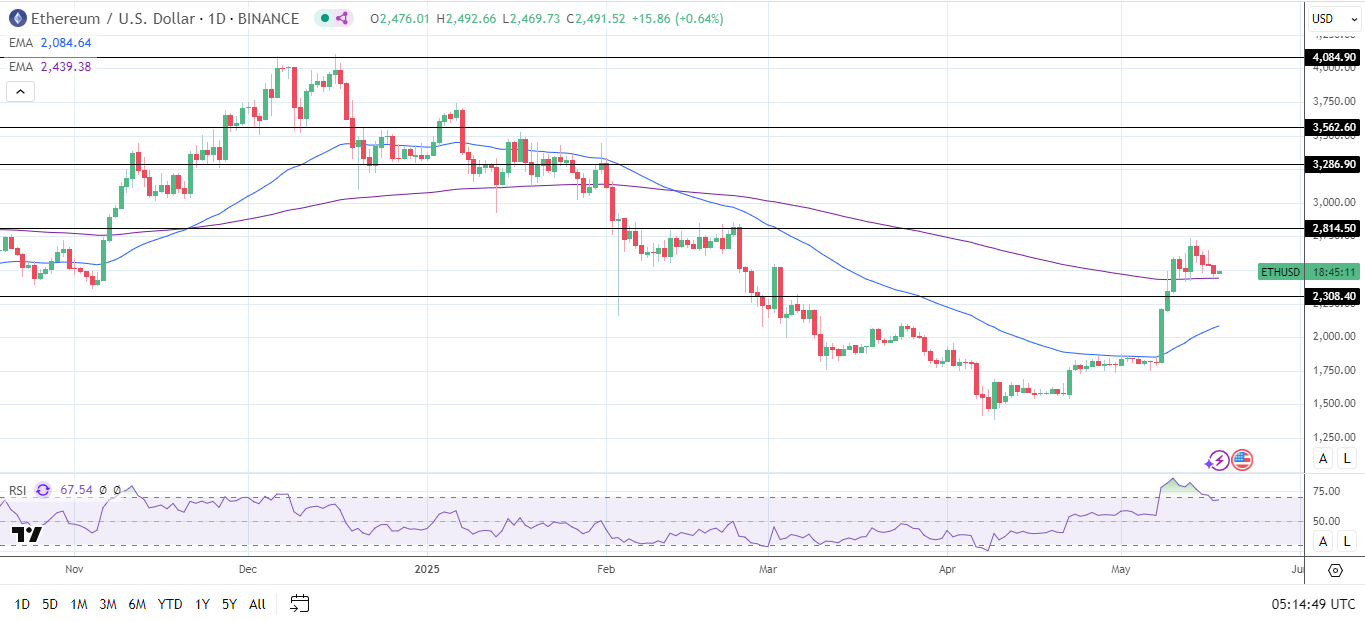
ETH remains above the 50-day and 200-day EMAs, affirming bullish momentum.
- Upside target: A breakout above the May 13 high of $2,738 could enable the bulls to target the $2,815 resistance level. A sustained move above $2,815 could bring $3,000 into play.
- Downside risks: If ETH drops below the 200-day EMA, the $2,308 support level would be the next key support level.
The 14-day Relative Strength Index (RSI) at 67.54 indicates ETH could climb to the May 13 high before entering overbought territory (RSI > 70).
Stay informed on BTC and ETH trends by tracking macroeconomic developments, ETF flows, and technical indicators in real-time here.
About the Author
Bob MasonChief Crypto Boss
123456789 30 He has written extensively for a broader audience and his current focus is on developments relating to the financial markets including, but not limited to currencies, commodities, alternative asset classes, and global equities.


Advertisement