
Advertisement
Advertisement
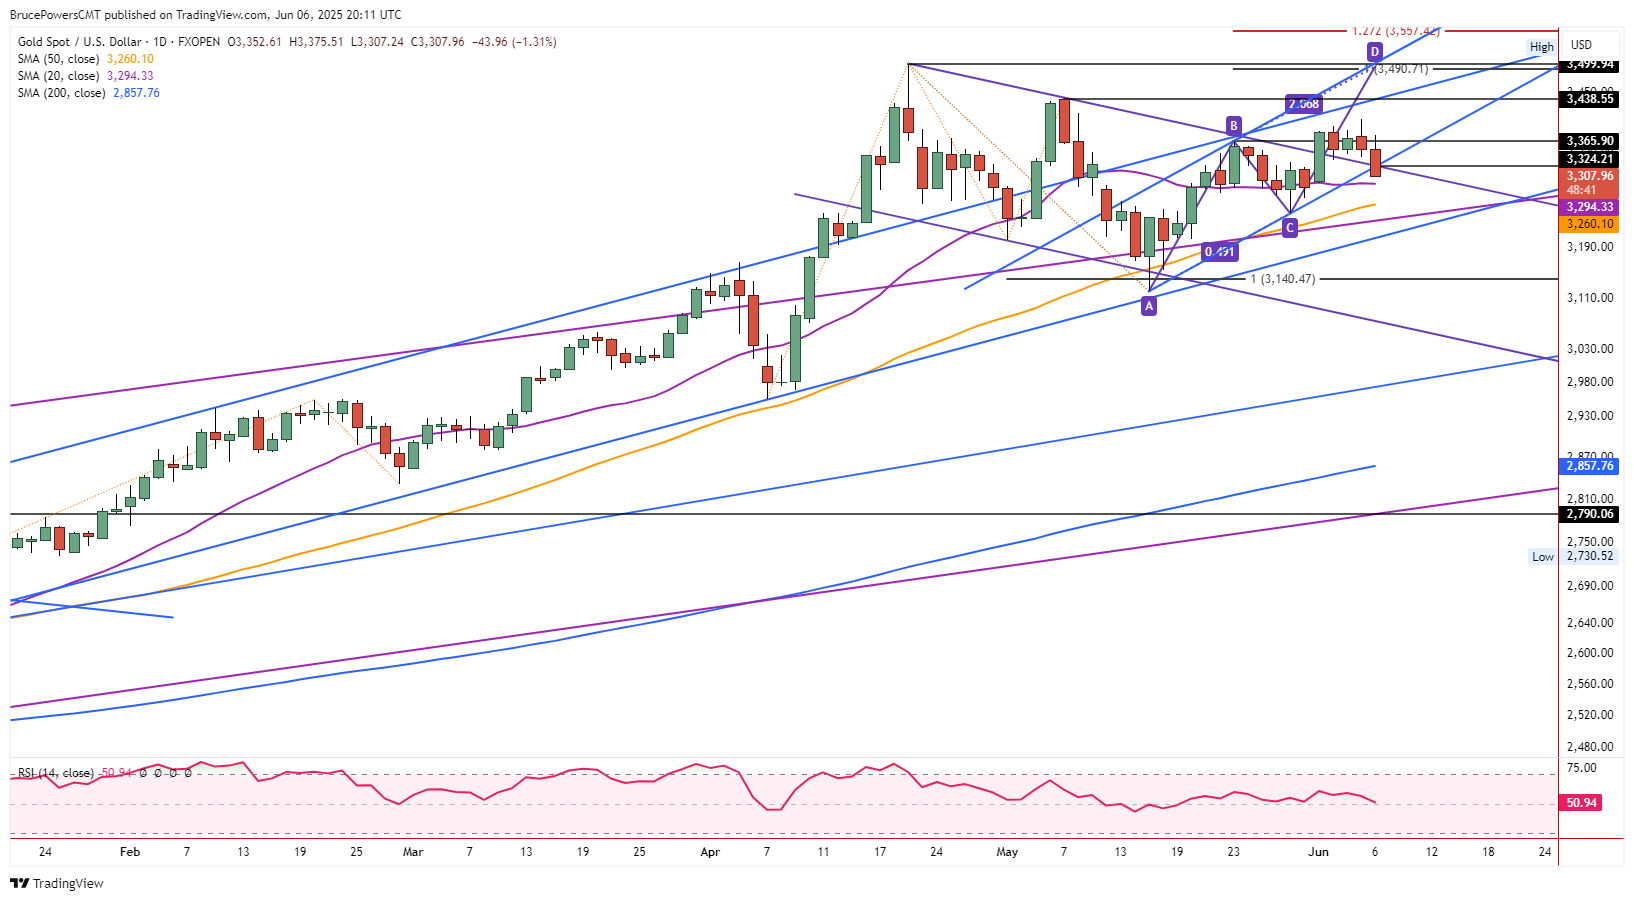
Gold (XAUUSD) Price Forecast: Retreats After Failed Breakout, Eyes Deeper Pullback
By:
Gold broke below near-term support on Friday, signaling a potential failed breakout and putting lower targets near $3,260 and $3,245 on the radar.
Sellers took back control of gold on Friday as it fell to a five-day low of $3,311 and established a lower daily high and lower low. It may still reach a lower price for the day before the closing of the session, as trading continues near the lows of the day, at the time of this writing. Near-term support levels, ending at $3,328, failed to halt the slide and it looks likely that a test of the 20-Day MA, now at $3,295, is likely.
Bearish Price Action
Today’s short-term bearish price action reflects weakness following a potentially significant bull breakout that was triggered on Monday. A double breakout occurred on Monday as gold rose above a downtrend line and prior swing high (B). Today’s price action shows a potential failure of the breakout, as there has been no upside follow-through, other than a failed attempt to continue higher on Thursday.
Gold fell below two trendlines today that represented potential support, a declining purple line and rising blue line. A decline below the lower blue line could lead to further weakness as it represented dynamic support for the near-term uptrend that began from the May swing low (A). This will change the angle of ascent for the trend and therefore a recovery may not occur quickly.
Potential Support Levels
Potential support around the 20-Day MA at $3,29, is enhanced by this week’s low, which showed support at $3,296. However, it also indicates a greater potential risk of a deeper pullback. Gold is set to end the week with a bearish shooting star weekly candlestick pattern. And it follows a failed upside breakout. Failed patterns can lead to sharp moves the other direction.
Weekly Bearish Pattern
A drop below this week’s low will make last week’s low of $3,245, a potential downside target. Note that it aligns with the higher swing low (C) on the daily chart. However, the 50-Day MA marks a potential higher support level, now at $3,260. The 20-Day MA has not been confirmed as key dynamic trend support yet as the line has gone through a consolidation range since the May 1 interim swing low. Therefore, the 50-Day MA becomes a potential target.
For a look at all of today’s economic events, check out our economic calendar.
About the Author
Bruce Powerscontributor
Bruce has been involved in the financial markets for over 20 years, as an analyst, trader, educator, and writer.


Advertisement