
Advertisement
Advertisement
Bitcoin (BTC) Outlook: Bullish Streak Toward $70k Fueled by US Politics and ETF Inflows
By:
Key Points:
- BTC extends its winning streak, closing at $67,519, fueled by ETF inflows and rising Trump election odds.
- US BTC-spot ETF market sees $58.7M in inflows, with Fidelity, Bitwise, and ARK leading the charge on bullish investor sentiment.
- Polymarket raises Trump’s election odds to 58.5%, boosting demand for BTC as investors anticipate regulatory changes.

In this article:
BTC Extends Winning Streak to Three Sessions
On Wednesday, October 16, BTC gained 0.77%, following a 5.36% rally from the previous day to close at $67,519. Significantly, BTC extended its winning streak to three sessions.
US politics and US BTC-spot ETF inflows drove demand for BTC
On Wednesday, US Republican Party front-runner Donald Trump made the crypto news, raising hopes of a shift in the US regulatory landscape. Fox Business Journalist Eleanor Terrett reported that Republican Bryan Donalds stated Trump could ‘dismantle crypto regulatory headlock’ if elected. Bryan Donalds was speaking at the BlackTower’s Investor Day in Miami.
Meanwhile, betting platform Polymarket reported an increase in Trump’s odds of winning the US Presidential Election, rising from 54.7% on October 14 to 58.5% on October 17. A Trump victory could boost BTC demand, with Trump pledging to fire SEC Chair Gary Gensler on his first day in office.
Hopes of a Trump win coincided with bullish updates from Santiment. On Wednesday, Santiment commented on investor sentiment toward BTC, stating,
“Crowd sentiment is still firmly bullish toward Bitcoin (seeing 2x the bullish comments for every bearish one).”
US BTC-Spot ETF Inflows Reflect Bullish Sentiment
On Tuesday, the US BTC-spot ETF market reported total net inflows of $371 million, with inflows extending into Wednesday. According to Farside Investors:
- Fidelity Wise Origin Bitcoin Fund (FBTC) saw net inflows of $14.8 million. (Previous day: +$35.0 million).
- Bitwise Bitcoin ETF (BITB) reported inflows of $12.9 million. (Previous day: +$0.7 million).
- ARK 21Shares Bitcoin ETF (ARKB) had net inflows of $11.5 million (Previous day: +$14.7 million).
Excluding flow data for iShares Bitcoin Fund (IBIT), the US BTC-spot ETF market recorded total net inflows of $65.1 million. IBIT had net inflows of $288.8 million on Tuesday. Significantly, the US BTC-spot ETF market is eying a four-day inflow streak, tilting the supply-demand balance in BTC’s favor.
Outlook
Investors should remain alert as oversupply risks linger. The US government holds 203,239 BTC. BTC could experience selling pressure if the US government announces plans to sell its holdings.
However, recent US BTC-spot ETF market flow trends and sentiment toward the Fed rate path could mitigate oversupply risks. Stay updated with our real-time BTC analysis for further insights on managing potential risks.
Technical Analysis
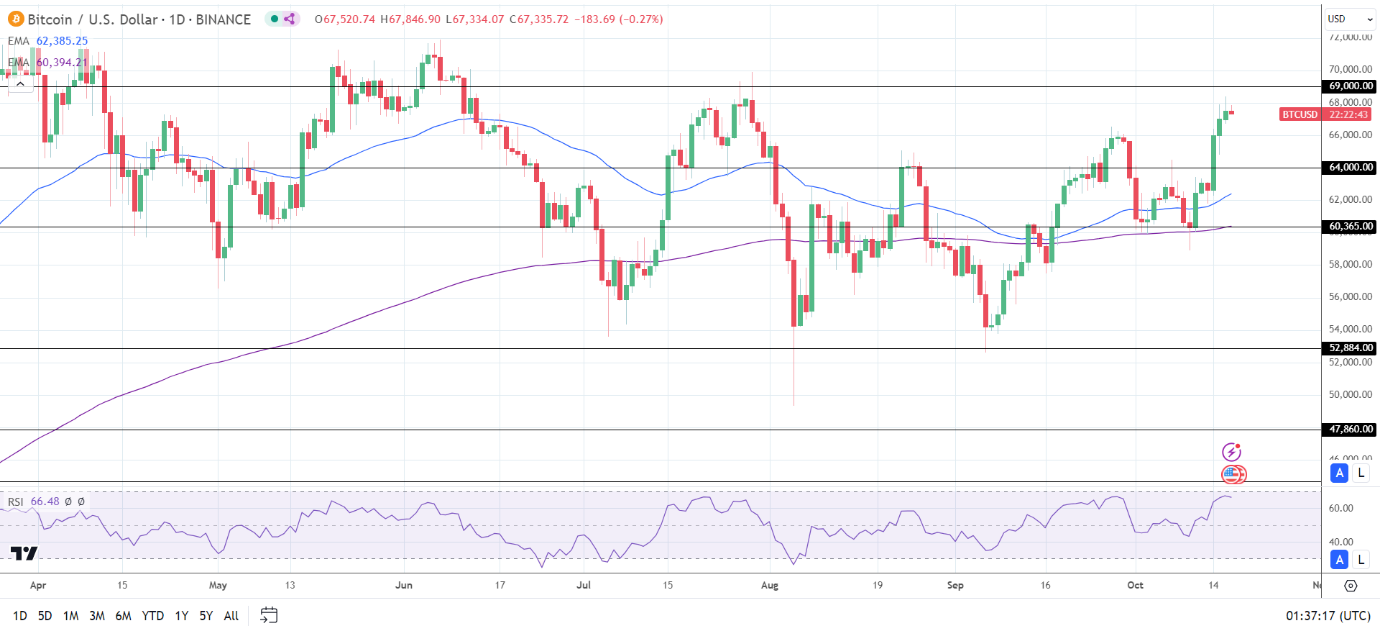
Bitcoin Analysis
BTC remains comfortably above the 50-day and 200-day EMAs, confirming bullish price trends.
A breakout from Wednesday’s high of $68,387 would bring the $69,000 resistance level into play. Furthermore, a break above the $69,000 resistance level may give the bulls a run at the $70,000 level.
Investors should consider sentiment toward the Fed rate path, the US Presidential Election, and US BTC-spot ETF market flow trends.
Conversely, a drop below the $65,000 and the $64,000 support level may signal a fall toward the 50-day EMA.
With a 67.01 14-day RSI reading, BTC may climb to the $69,000 resistance level before entering overbought territory.
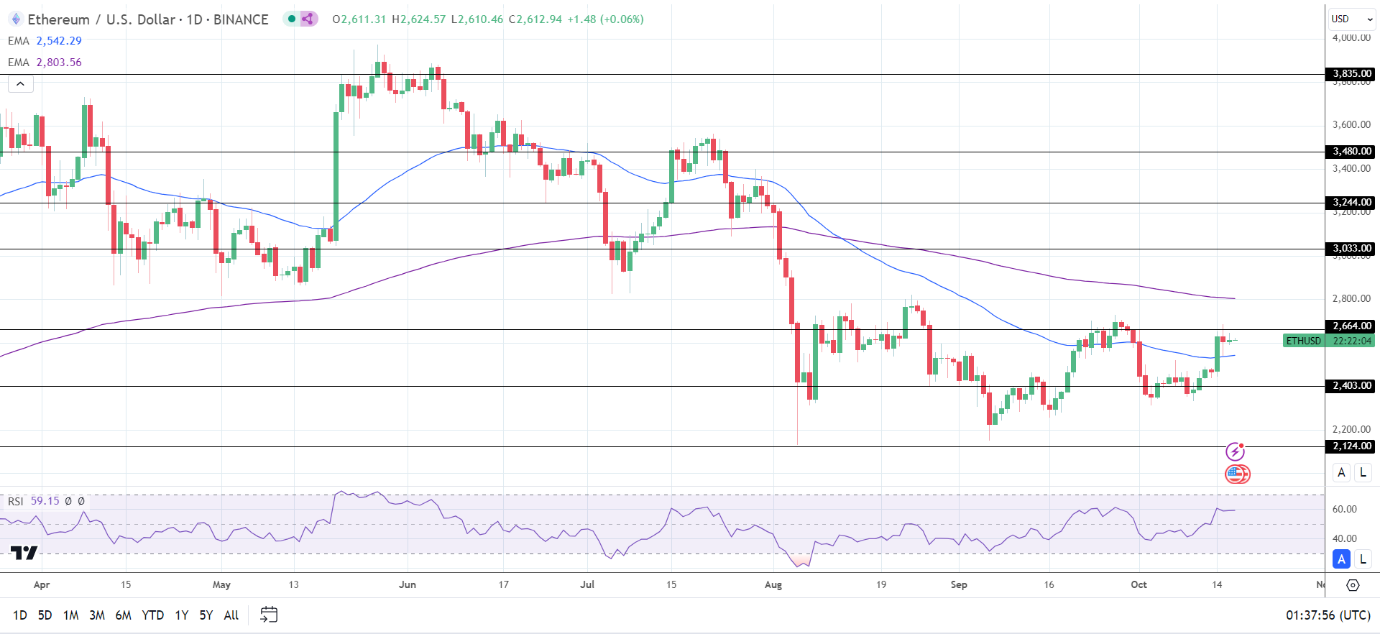
Ethereum Analysis
ETH remains above the 50-day EMA while hovering below the 200-day EMA, affirming bullish near-term but bearish price longer-term price signals.
An ETH break above the $2,664 resistance level could allow the bulls to test the 200-day EMA. Furthermore, a breakout from the 200-day EMA may support a move toward $3,000.
US ETH-spot ETF market-related updates also require consideration.
Conversely, an ETH break below the 50-day EMA could signal a fall toward the $2,403 support level.
The 14-period Daily RSI reading, 59.15, suggests an ETH break above the 200-day EMA before entering oversold territory.
About the Author
Bob MasonChief Crypto Boss
TEST 30 He has written extensively for a broader audience and his current focus is on developments relating to the financial markets including, but not limited to currencies, commodities, alternative asset classes, and global equities.
Latest news and analysis


Advertisement