
Advertisement
Advertisement
Bitcoin (BTC) Showing Bullish Signs Amid Microstrategy Rebrand
By:
Key Points:
- Elliott Wave count suggests BTC is preparing for a Wave 5 rally.
- BTC faces major resistance at $105,784 but maintains key support.
- Fibonacci extensions indicate potential upside targets above $120,000.

Bitcoin (BTC) is experiencing a crucial phase, navigating a corrective structure on the daily chart while forming a potential bullish setup on lower timeframes. Notably, institutional demand continues to strengthen as MicroStrategy rebrands to “Strategy”
With BTC currently consolidating near key Fibonacci retracement levels, the next move will be critical in determining whether a new impulse wave begins.
MicroStrategy Becomes ‘Strategy’
On February 5, 2025, MicroStrategy announced its rebranding to “Strategy,” reflecting its intensified focus on Bitcoin. This strategic move underscores its commitment to cryptocurrency, having invested an additional $20 billion in Bitcoin during the fourth quarter of 2024, marking its largest quarterly acquisition.
This brings the company’s total Bitcoin holdings to approximately 471,107 BTC, valued at around $45.65 billion at current market prices. Despite reporting a significant net loss of $670.8 million for the quarter, Strategy raised $584 million through preferred stock sales to fund its Bitcoin purchases.
The rebranding includes a new logo featuring a stylized “B,” symbolizing the company’s deepening focus on Bitcoin as a central component of its corporate strategy.
BTC Price Analysis
Bitcoin’s daily chart presents a clear Elliott Wave structure, where BTC appears to have completed Wave 3 and entered a corrective Wave 4 phase. The correction found support near $93,260, aligning with the 0.236 Fibonacci retracement level, and BTC has since rebounded. However, resistance near $105,784 remains a crucial hurdle for bullish continuation.
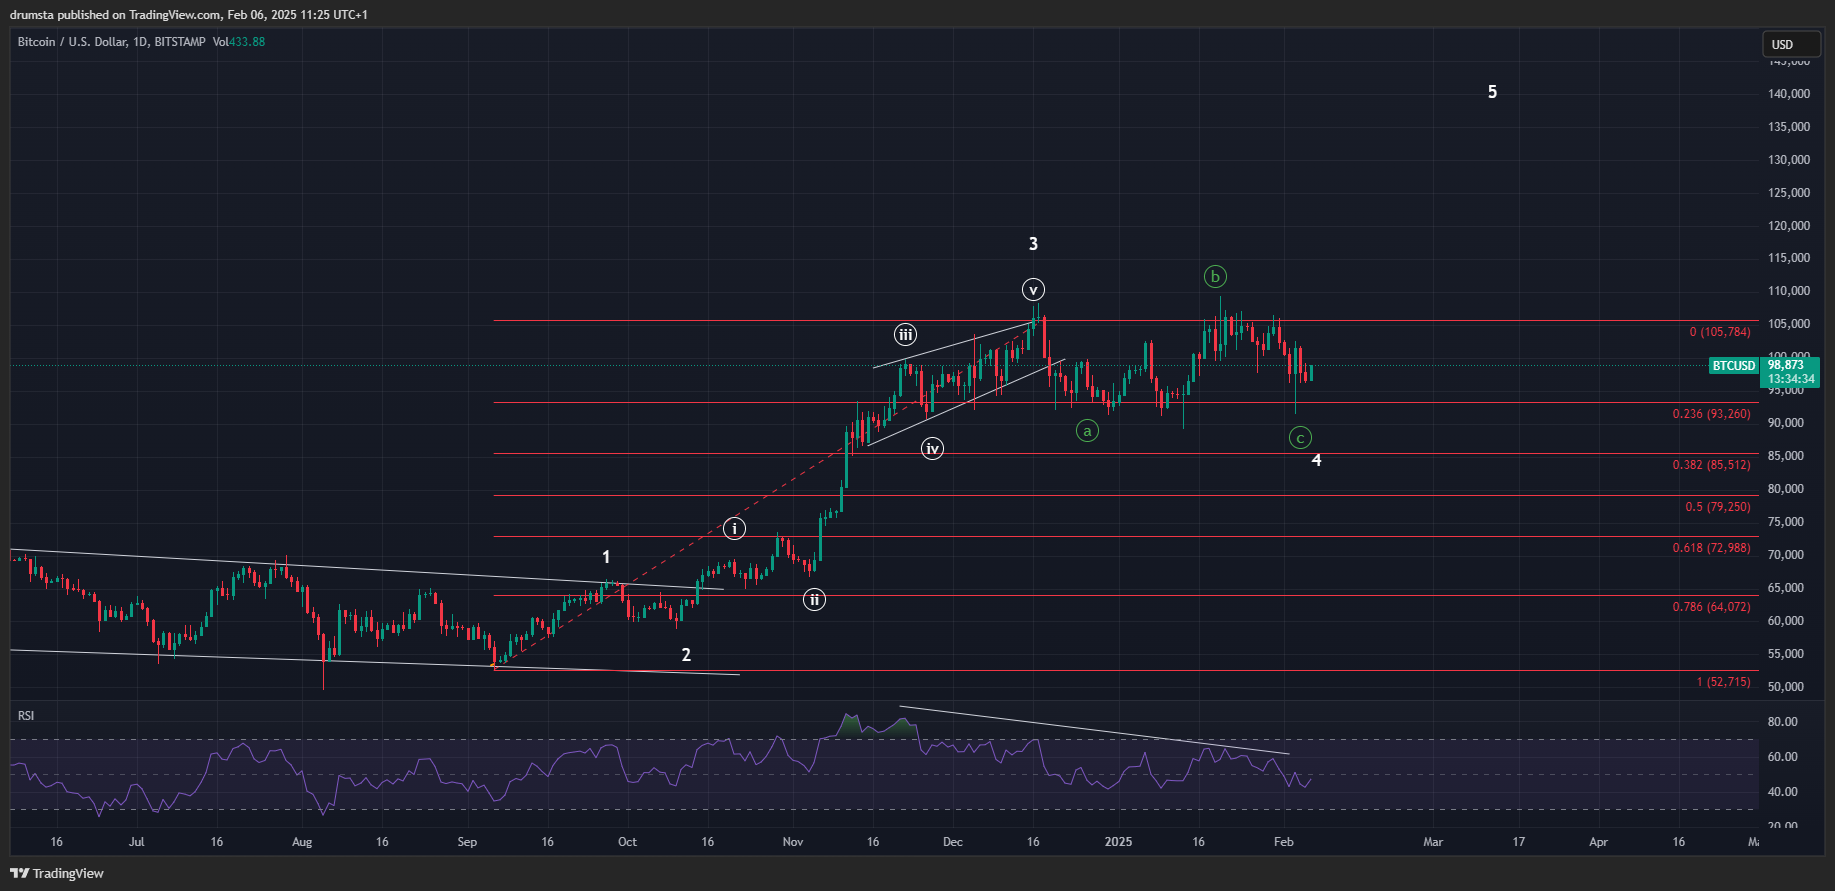
The structure suggests BTC is still in a consolidation phase, with a breakout above the key resistance zone required to confirm the initiation of Wave 5. Relative Strength Index (RSI) on the daily timeframe has been forming a hidden bullish divergence, indicating the potential for renewed momentum. The 0.382 Fibonacci support at $85,512 remains a critical level to watch if BTC fails to sustain its recovery.
From an Elliott Wave perspective, if BTC successfully reclaims $105,784, it could confirm the beginning of Wave 5, potentially driving the price toward new highs. Fibonacci extensions indicate potential targets between $116,263 and $122,413. Conversely, a rejection at resistance could extend the correction further, with support levels near $85,512 and $79,250 acting as key downside zones.
BTC Price Prediction
On the 1-hour chart, Bitcoin is attempting to break out of a descending wedge, likely marking the end of Wave (ii) within a developing five-wave sequence. If this breakout sustains, BTC could be entering Wave (iii), with potential upside targets at $109,017 (1.272 Fibonacci extension) and $112,461 (1.618 Fibonacci extension).
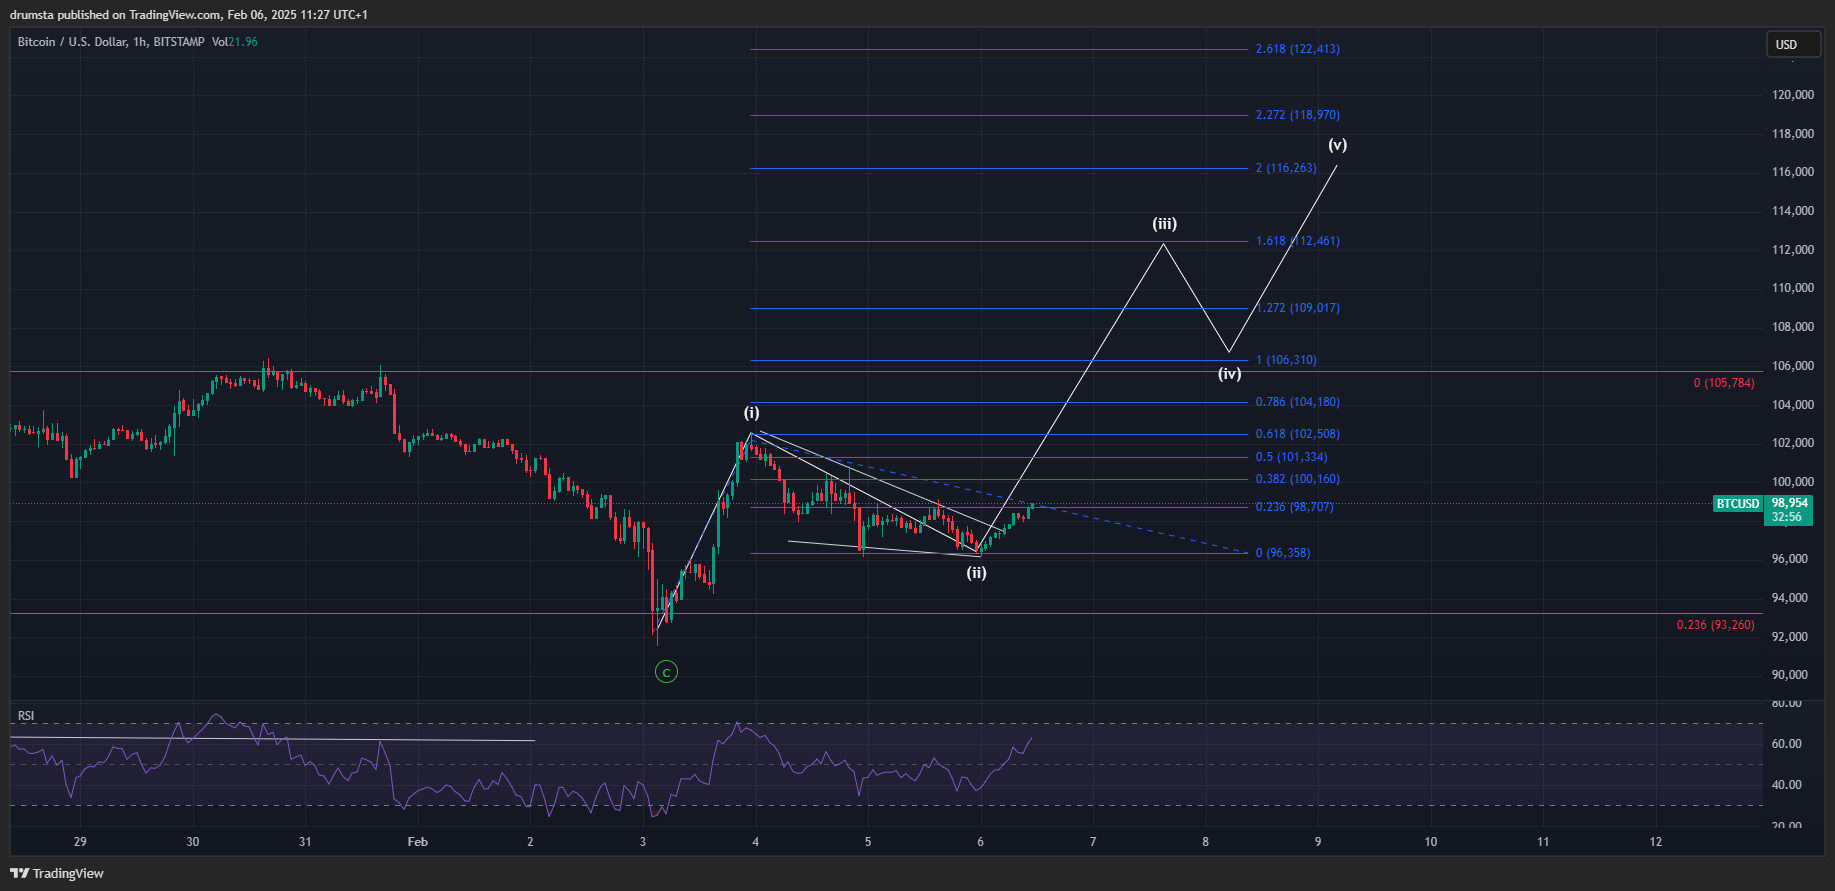
The short-term wave count suggests that BTC has completed its corrective phase and is beginning a new impulsive move. A clean break above the $101,334 resistance level would provide further confirmation. The RSI has moved above 50, indicating rising bullish momentum. However, BTC must hold above $96,358 to maintain the bullish structure.
If BTC follows the expected Elliott Wave progression, Wave (iii) could extend toward $112,461, followed by a minor pullback in Wave (iv) before a final push in Wave (v) toward $116,263–$122,413. Failure to maintain structure could see a retest of lower support levels at $96,358 and $93,260.
Key Levels to Watch
- Immediate Resistance: $105,784 (previous peak)
- Key Resistance: $106,310 (1.0 Fibonacci extension)
- Major Resistance: $112,461 (1.618 Fibonacci extension)
- Immediate Support: $98,707 (0.236 Fibonacci retracement)
- Key Support: $96,358 (local low)
- Critical Support: $93,260 (0.236 Fibonacci retracement)
- Short-Term Target for Wave (v): $116,263 – $122,413
- Invalidation Zone: Below $96,358
About the Author
Bob MasonChief Crypto Boss
TEST 30 He has written extensively for a broader audience and his current focus is on developments relating to the financial markets including, but not limited to currencies, commodities, alternative asset classes, and global equities.
Latest news and analysis


Advertisement