
Advertisement
Advertisement
Bitcoin (BTC) Slides as U.S. Airstrikes on Iran Trigger Risk-Off Sentiment
By:
Key Points:
- Bitcoin (BTC) fell 1.17% after U.S. strikes on Iran’s nuclear sites spooked markets and triggered risk-off sentiment.
- BTC avoided sub-$100K despite heightened geopolitical risk, highlighting ETF inflows as a critical price buffer.
- BlackRock’s IBIT led with $1.23B in ETF inflows last week, while other funds like FBTC and ARKB saw outflows.

Bitcoin Slides as US Hits Iran’s Strategic Nuclear Sites
Bitcoin (BTC) dropped 1.17% on Saturday, June 21, extending its losses from Friday (-1.19%), closing at $102,181. Notably, BTC’s losses mirrored the broader crypto market, which declined 1.68% to a total market cap of $3.1 trillion.
News of US strikes on Iran’s key nuclear sites impacted demand for risk assets on June 21. President Trump announced the strikes, stating:
“We have completed our very successful attack on the three Nuclear sites in Iran, including Fordow, Natanz, and Esfahan. All planes are now outside of Iran airspace. A full payload of BOMBS was dropped on the primary site, Fordow.”
The June 21 US strike followed unproductive Iran-EU talks on June 20, where Iran stated it would not progress talks until Israel ended its attacks.
The Iranian government had previously warned US involvement would expand the conflict to the region.
US BTC-Spot ETF Inflows Cushion Losses Amid Rising Geopolitical Tensions
Despite two days of losses, BTC remained above the $100,000 psychological support level, underscoring the importance of US BTC-spot ETF market flow trends.
The US BTC-spot ETF market extended its inflow streak to nine sessions on June 20. A nine-day inflow streak led to $1,023.4 million in total net inflows for the week ending June 20. According to Farside Investors, key flow trends for the week included:
- BlackRock’s (BLK) iShares Bitcoin Trust (IBIT) dominated, with weekly net inflows of $1,231.4 million.
- Meanwhile, Fidelity Wise Origin Bitcoin Fund (FBTC) and ARK 21Shares Bitcoin ETF (ARKB) had net outflows of $61.6 million and $187.8 million, respectively.
US BTC-spot ETF inflows sent BTC to a record high of $111,917 in May.
BTC Price Outlook: Key Drivers
BTC’s near-term outlook depends on several key macro and market drivers:
- Middle East conflict-related news.
- Trade developments.
- Legislative updates, including Bitcoin Act-related news.
- The upcoming US economic data and Fed guidance.
- US BTC-spot ETF flows.
BTC Price Scenarios:
- Bullish Scenario: Easing geopolitical risks, dovish Fed signals, bipartisan support for crypto bills, upbeat US data, and ETF inflows may send BTC toward $111,917.
- Bearish Scenario: Escalating geopolitical tensions, hawkish Fed cues, legislative setbacks, US recession fears, or ETF outflows could drag BTC below $100,000.
For ongoing insights into macro trends, regulation, and ETF data, follow our analysis here.
Technical Analysis
Bitcoin Analysis
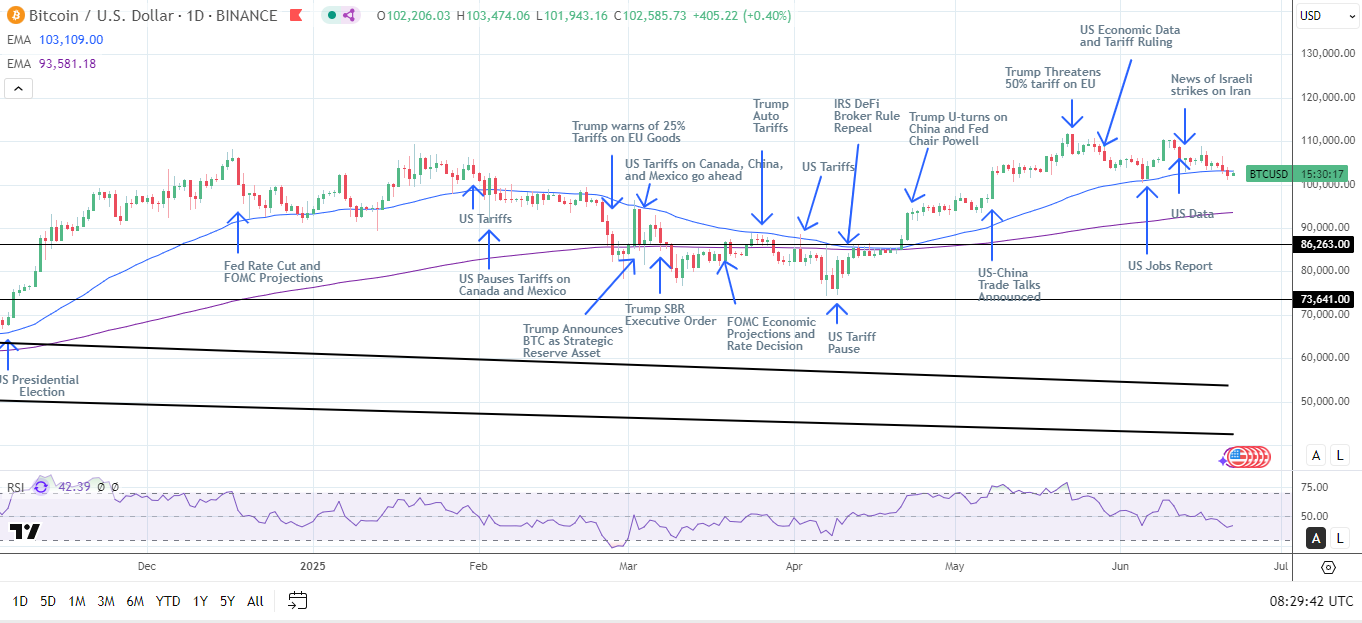
BTC is trading below its 50-day Exponential Moving Average (EMA) while holding above the 200-day EMA. The EMAs suggest a bearish near-term bias while affirming bullish longer-term momentum.
- Upside Target: A breakout above the 50-day EMA could signal a move toward $105,000. A sustained move through $105,000 could pave the way to retesting resistance at the record high of $111,917.
- Downside Risk: A drop below $100,000 could expose $95,000 and potentially the 200-day EMA.
The 14-day Relative Strength Index (RSI) at 40.99 suggests BTC could drop to the 200-day EMA before entering oversold territory (RSI< 30).
Stay ahead of market trends by accessing real-time BTC price data and technical indicators here.
Ethereum Analysis
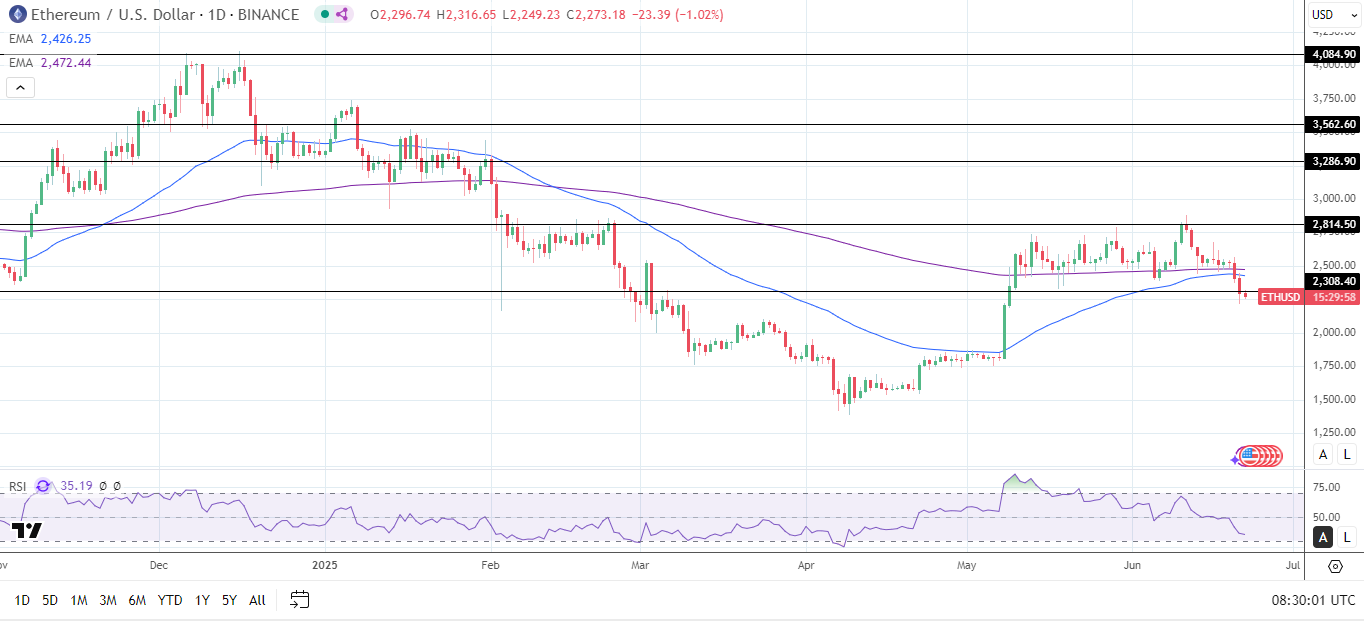
Turning to ethereum (ETH), ETH trades below the 50-day and 200-day EMAs, sending bearish price signals. Rising geopolitical tensions and weak US ETH-spot ETF market inflows pressured demand.
- Upside target: A breakout above the $2,308 resistance level could signal a move toward the 50-day and 200-day EMAs. A sustained break above the EMAs may open the door to retesting the $2,815 resistance level.
- Downside risks: If ETH breaks below $2,150, $2,000 would be the next key support level.
The 14-day Relative Strength Index (RSI) at 34.87 indicates ETH could drop to the $2,150 support level before entering oversold territory (RSI< 30).
Stay informed on BTC and ETH trends by tracking macroeconomic developments, ETF flows, and technical indicators here.
About the Author
Bob MasonChief Crypto Boss
123456789 30 He has written extensively for a broader audience and his current focus is on developments relating to the financial markets including, but not limited to currencies, commodities, alternative asset classes, and global equities.


Advertisement