
Advertisement
Advertisement
Bitcoin, Ethereum, XRP Analysis: Will Altcoins Follow BTC’s Pump to Record Highs
By:
Key Points:
- Bitcoin hits a new all-time high and breaks out of a bull flag, targeting $152K next.
- Ethereum must clear $2,950 resistance to confirm a move toward its $4,800 peak.
- XRP forms a bearish reversal pattern, risking a drop toward $1.10 support.

Bitcoin (BTC) hit a new all-time high this week, briefly surging to $110,000 after the advancement of a pro-crypto stablecoin bill in the US Senate fueled optimism for regulatory clarity under President Donald Trump.
The milestone comes amid renewed investor confidence in digital assets, with the broader crypto market, including Ether (ETH) and XRP (XRP), showing signs of volatility following the news. While Bitcoin led the charge, altcoins have yet to confirm whether they’ll follow BTC’s breakout or continue lagging behind.
Bitcoin Eyes $152K After Bull Flag Breakout
Bitcoin has surged past the upper trendline of its multimonth descending channel — a classic bull flag — to reclaim the $110,000 level. Historically, such breakouts have preceded massive rallies, and the current setup projects a potential price target near $152,000, based on the height of the flagpole.
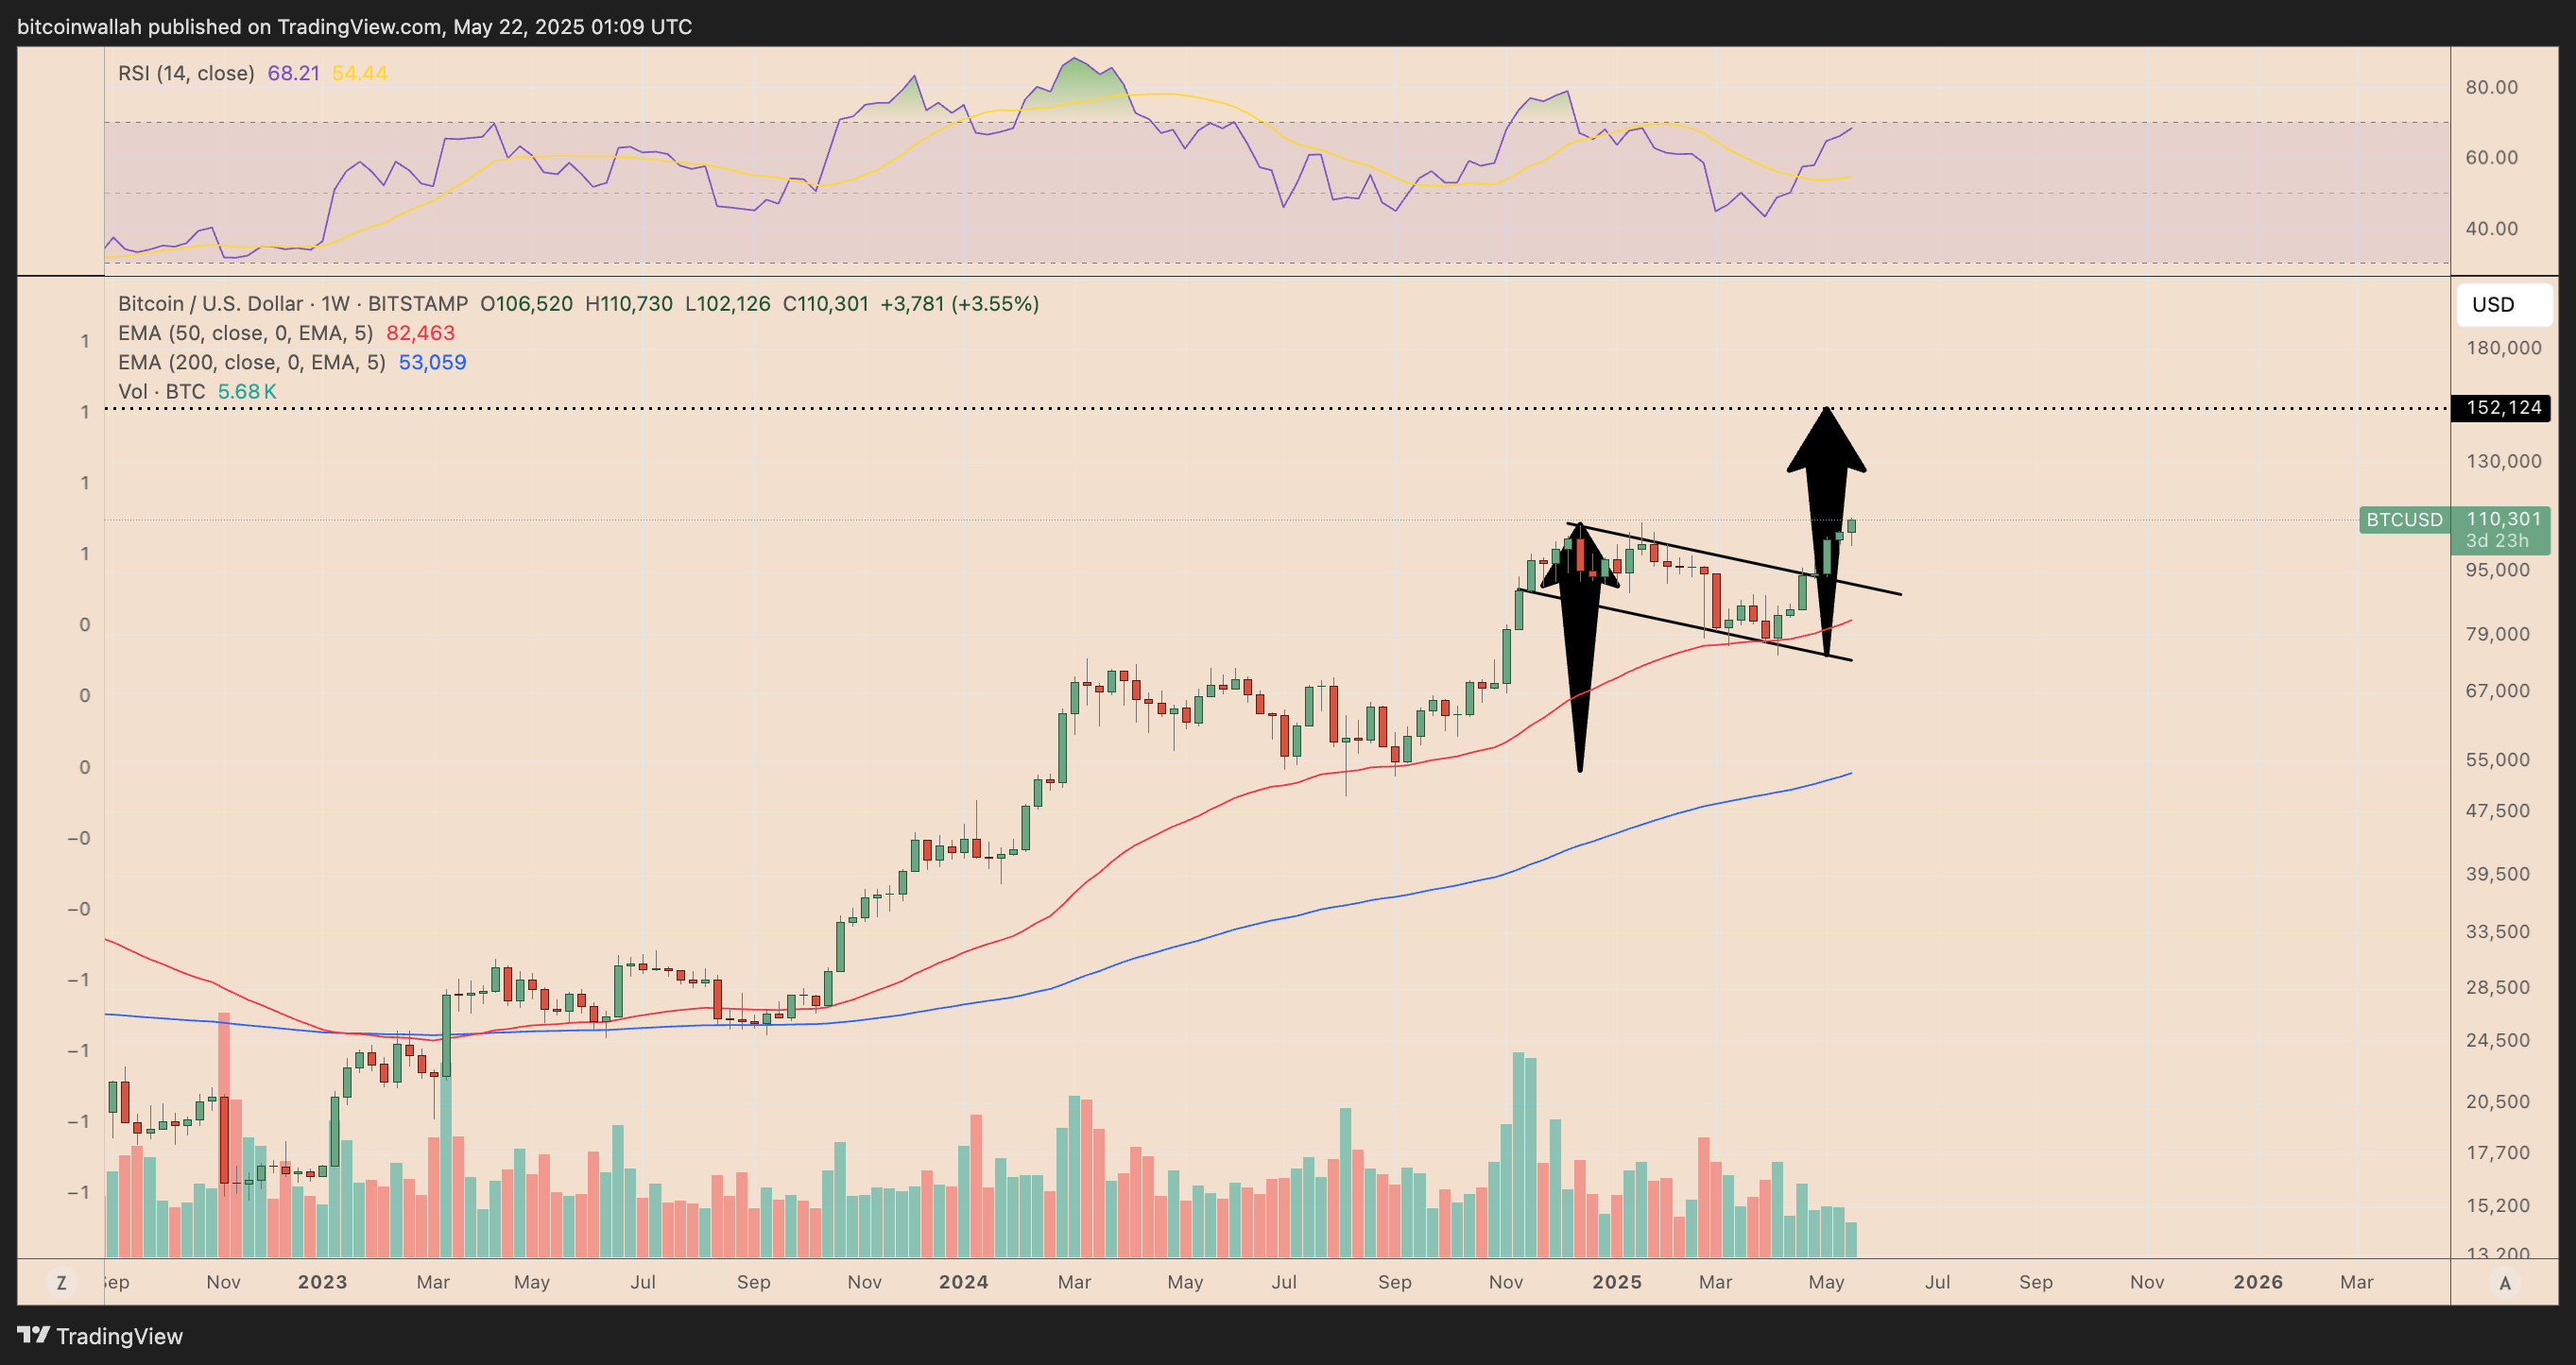
The weekly relative strength index (RSI) sits just below 70, not yet overbought, giving bulls more runway. The 50-week exponential moving average (EMA) also continues to hold as solid dynamic support near $82,000. With increasing volume, the breakout appears to have technical strength.
Ethereum Targets $4,800 If Key Resistance Breaks
Ethereum has bounced nearly 50% from its local bottom and now approaches a decisive resistance near $2,950, which coincides with the lower trendline of its long-term ascending channel. This region also aligns with the 0.5 Fibonacci retracement level from its $4,800 peak.
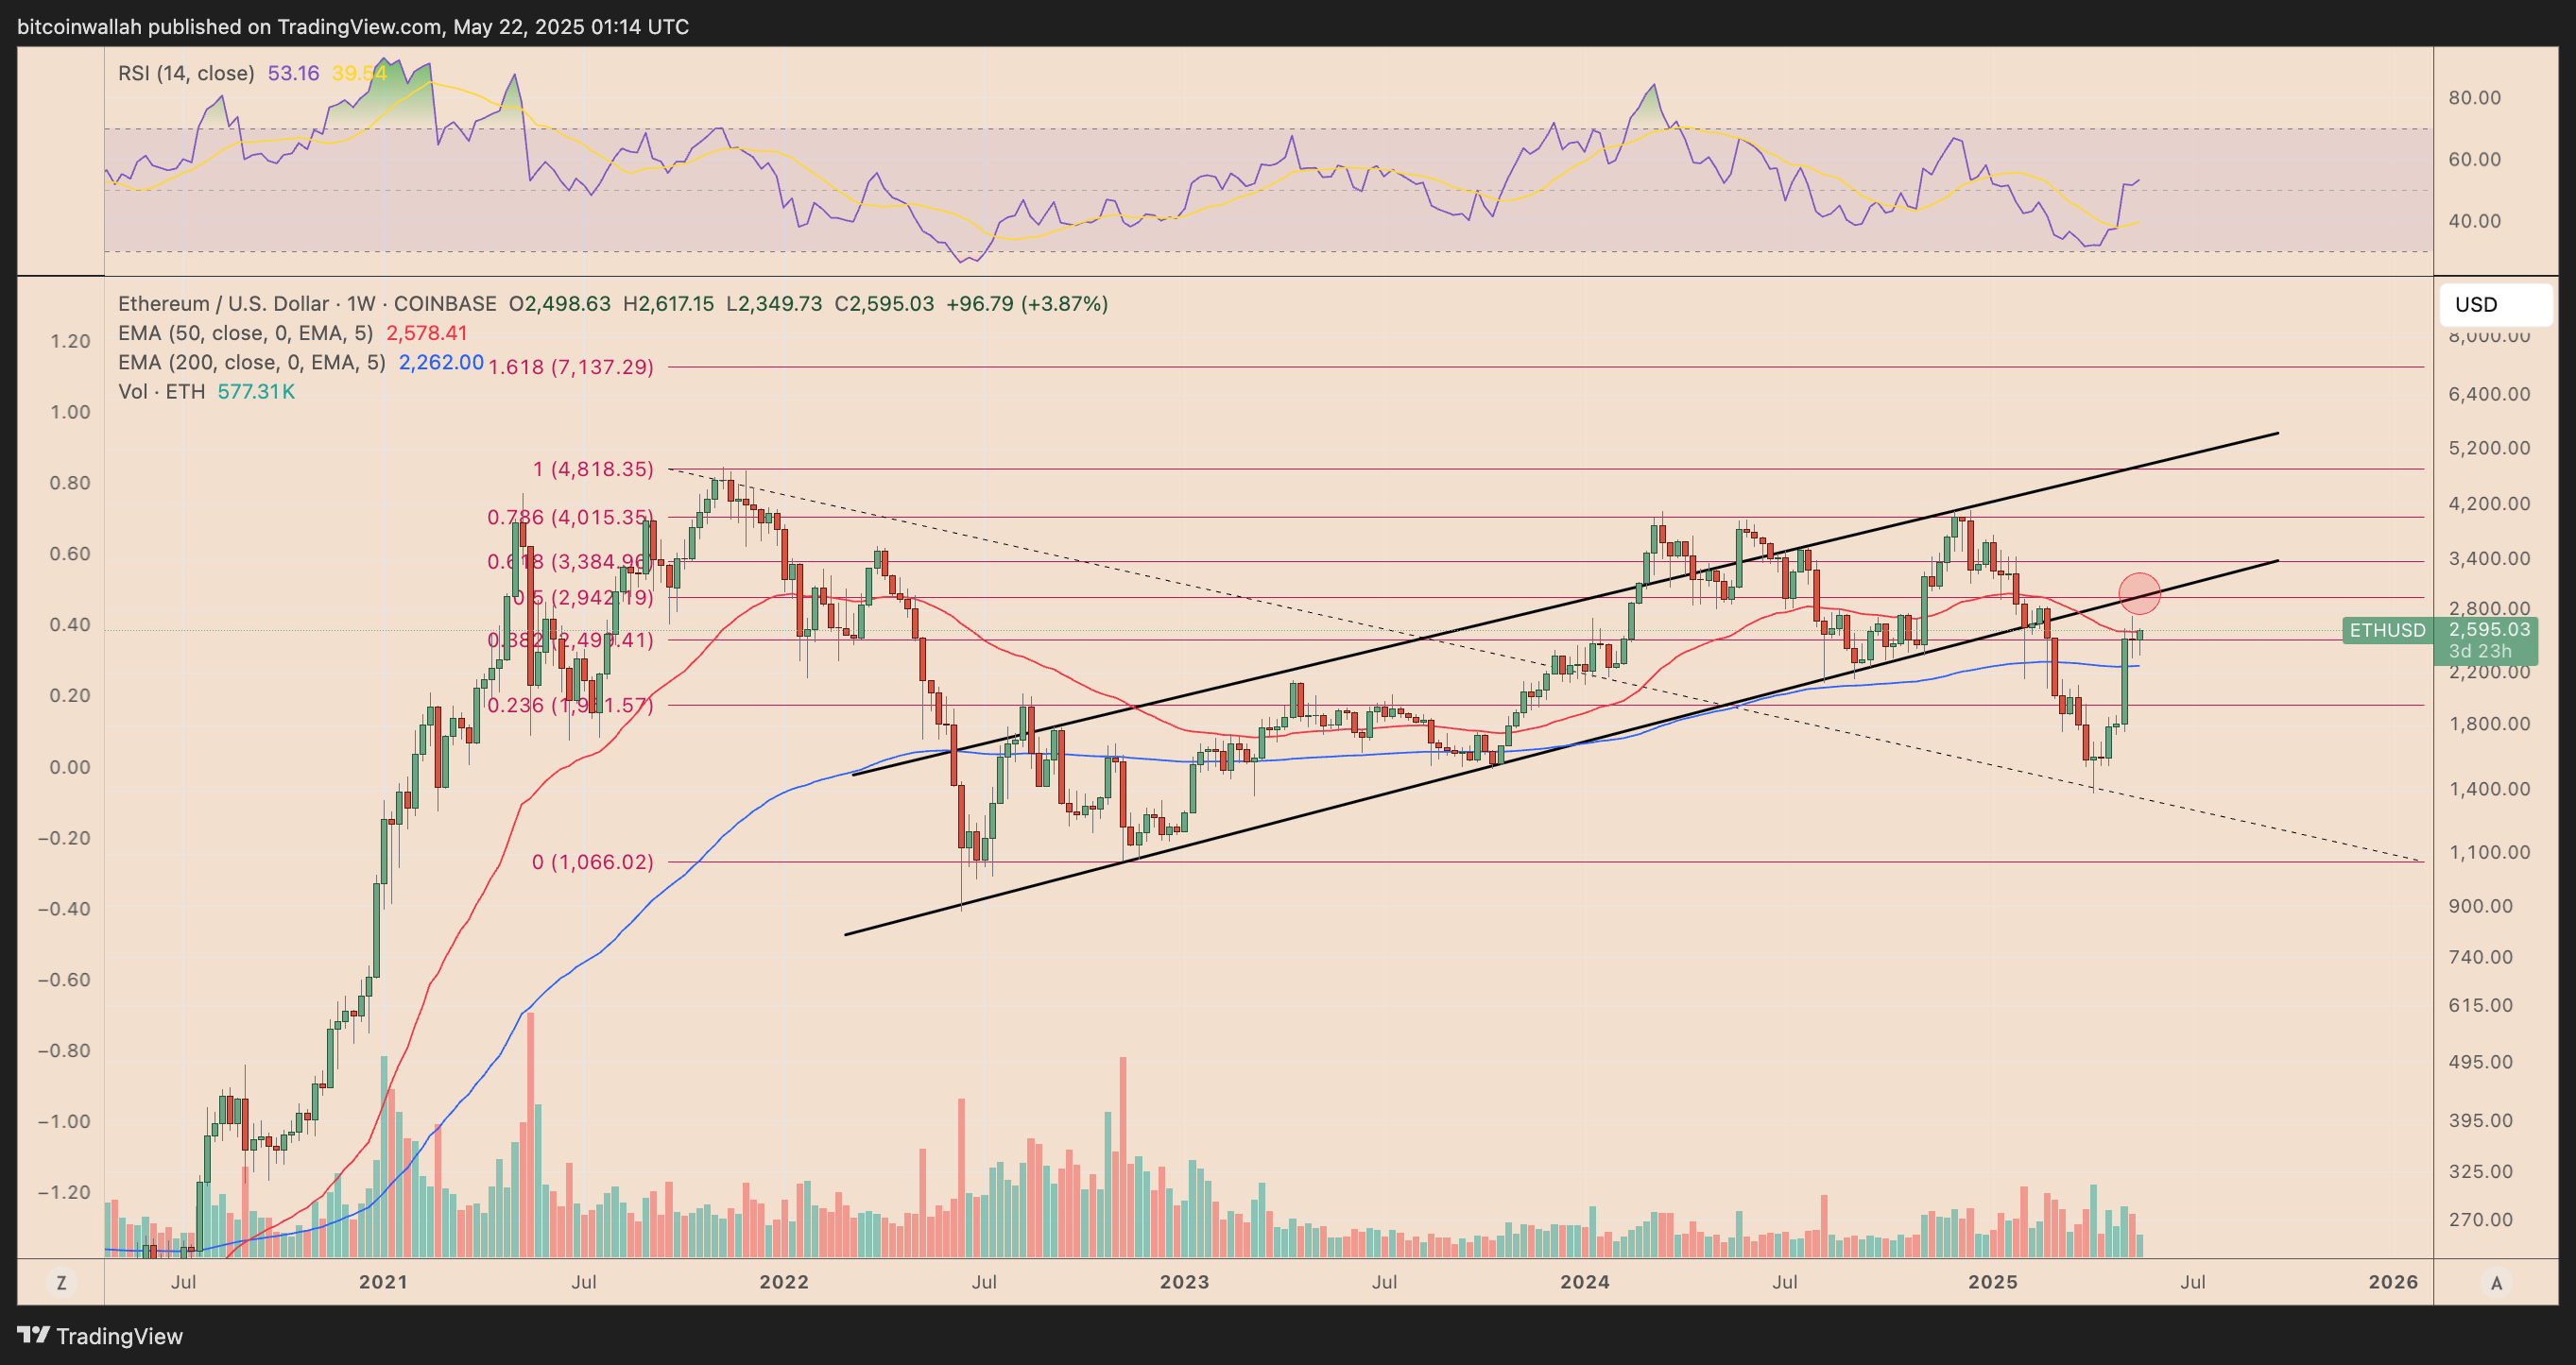
A confirmed breakout above this zone would open the path to the channel’s upper trendline near $4,800, reinforcing a broader bullish thesis. However, the weekly RSI still hovers around neutral levels, suggesting ETH needs strong momentum to push through this supply zone.
XRP Risks Deeper Losses Amid Bearish Pattern
While Bitcoin and Ethereum flash bullish patterns, XRP paints a starkly different technical picture. The token has likely formed a cup-and-handle top, a bearish reversal setup that threatens a retest of key support near $1.10, roughly the level of its 200-week EMA.
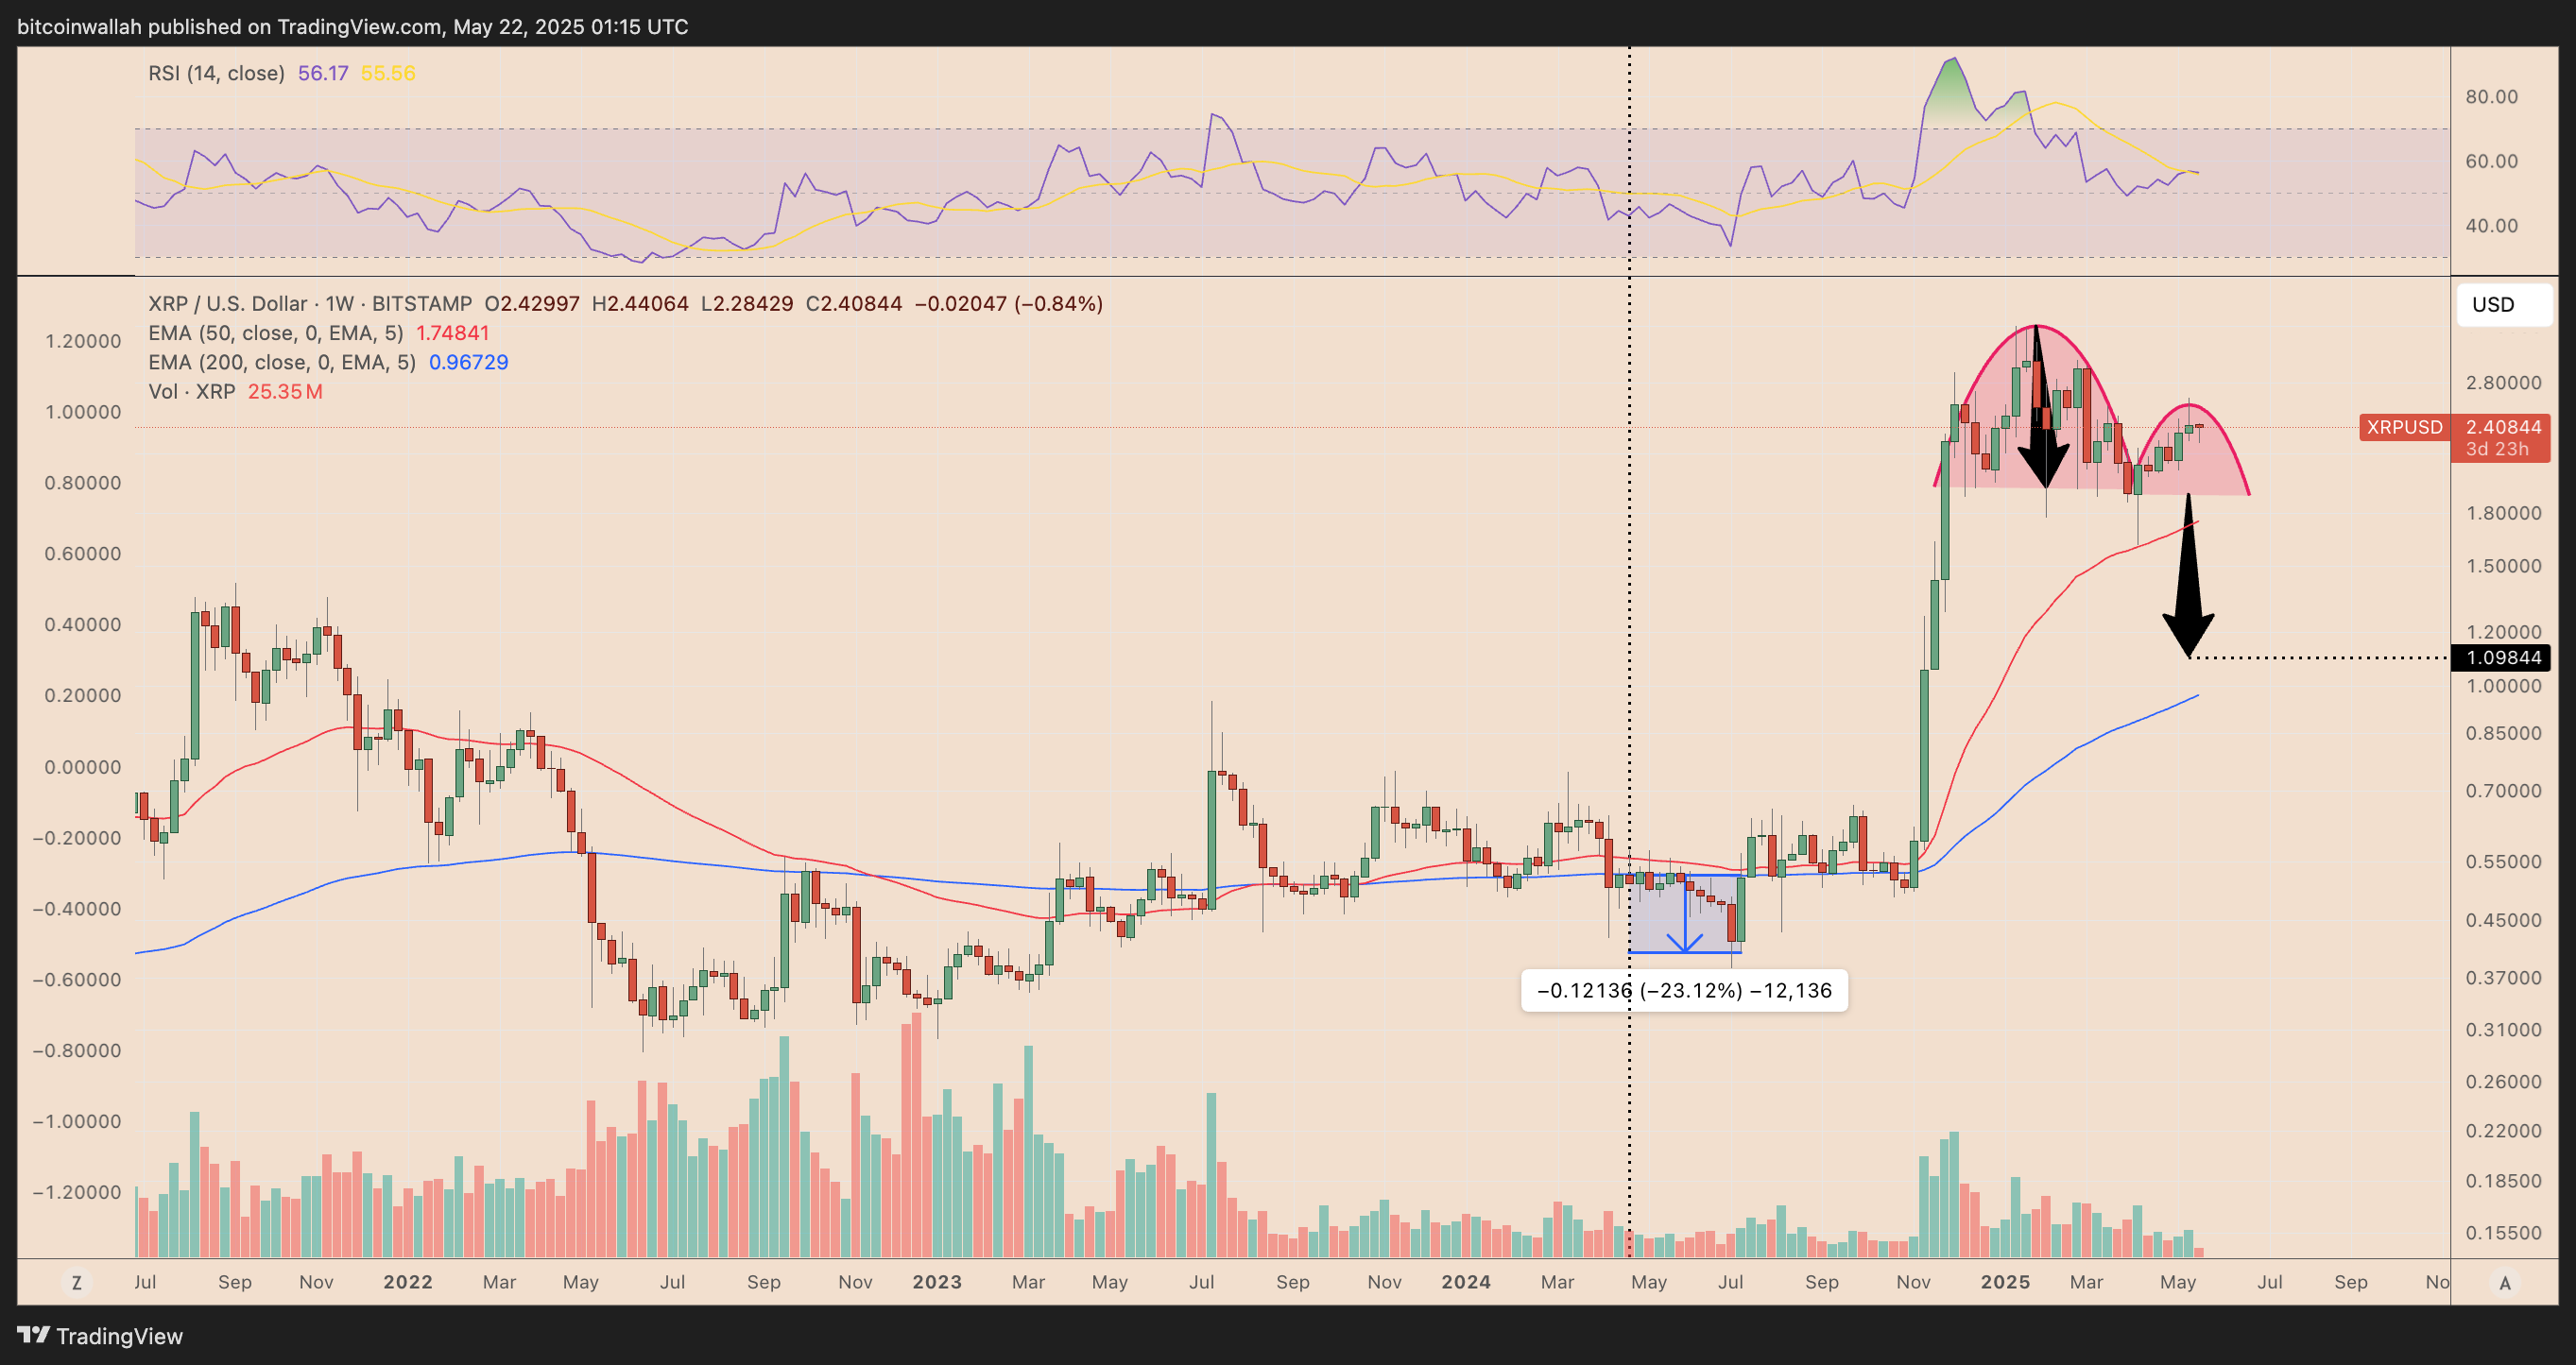
After failing to flip the $2.80 resistance into support, XRP/USD has traced a rounded top with lower highs, weakening its market structure. The declining RSI reinforces this view, and a breakdown below $2.00 could trigger a deeper decline.
About the Author
Bob MasonChief Crypto Boss
123456789 30 He has written extensively for a broader audience and his current focus is on developments relating to the financial markets including, but not limited to currencies, commodities, alternative asset classes, and global equities.


Advertisement