
Advertisement
Advertisement
Bitcoin Will Rebound Sharply Despite Israel-Iran Conflict — Blockstream CEO Presents Fractal Evidence
By:
Key Points:
- Bitcoin dropped 5.5% after Israel’s airstrikes on Iran, but historical data suggests rebounds often follow such geopolitical shocks.
- BTC has outperformed gold and the S&P 500 within 60 days of past crisis events, including COVID-19 and the 2020 U.S.–Iran escalation.
- Technical analysts see Bitcoin repeating a 2024 breakout pattern, with potential upside toward $150,000 by year-end.

Bitcoin (BTC) plunged sharply following renewed conflict between Israel and Iran, but if history is any guide, the dip may be short-lived.
Since June 12, the top cryptocurrency has dipped by around 5.50% to below $103,000. Its plunge accompanies a dwindling risk-on sentiment, with S&P 500 futures dropping 1.50% after reports confirmed Israel had launched airstrikes on Iranian military sites.
Veteran gold proponent Peter Schiff quickly weighed in, arguing that the market reaction proves that Bitcoin isn’t a haven.
Israel attacks Iran. Oil prices jump 5% while S&P futures fall 1.5%. In response, investors seeking a safe haven buy gold, sending its price up 0.85%. Meanwhile, investors dump Bitcoin, pushing its price down 2%. How can anyone consider Bitcoin to be a digital version of gold?
— Peter Schiff (@PeterSchiff) June 13, 2025
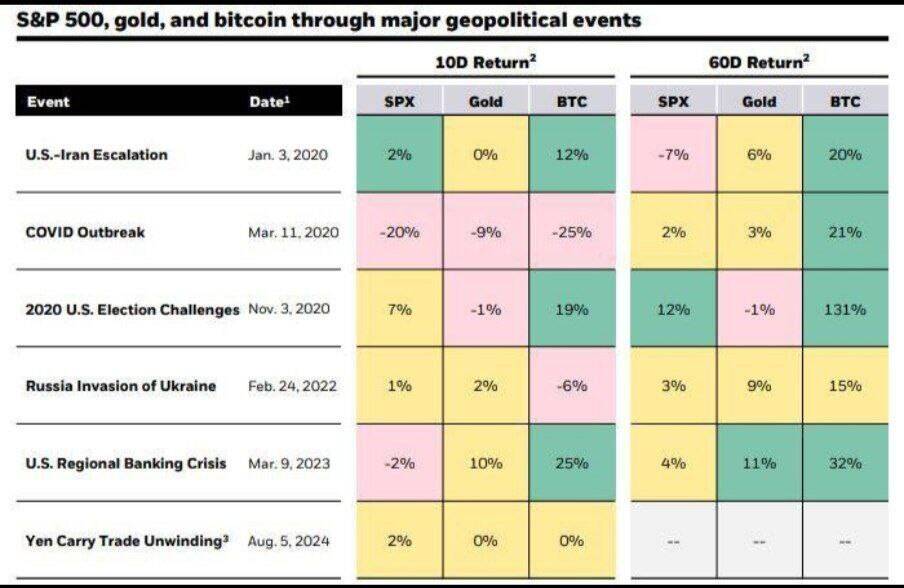
But Blockstream CEO Adam Back countered by pointing to data, showing Bitcoin has massively outperformed immediately after major geopolitical events such as the Iran-Israel conflict.
Bitcoin Tends to Outperform Weeks After Crisis Events
A historical breakdown of Bitcoin’s performance during major geopolitical or financial shocks reveals a clear trend. BTC falls sharply in the first few days, but it tends to bounce back stronger than both gold and the S&P 500 over the following weeks.
Note that:
-
During the US regional banking crisis in March 2023, Bitcoin surged 32% over two months, while gold gained 11% and equities rose just 4%.
-
Even during the COVID-19 outbreak, Bitcoin recovered from a -25% 10-day drop to post 21% gains in 60 days, outperforming traditional assets.
The standout case came during the 2020 US election challenges, when BTC skyrocketed 131% within 60 days, a level of resilience unmatched by gold or stocks.
Bitcoin’s 2024-Era Support Hints at $150K Next
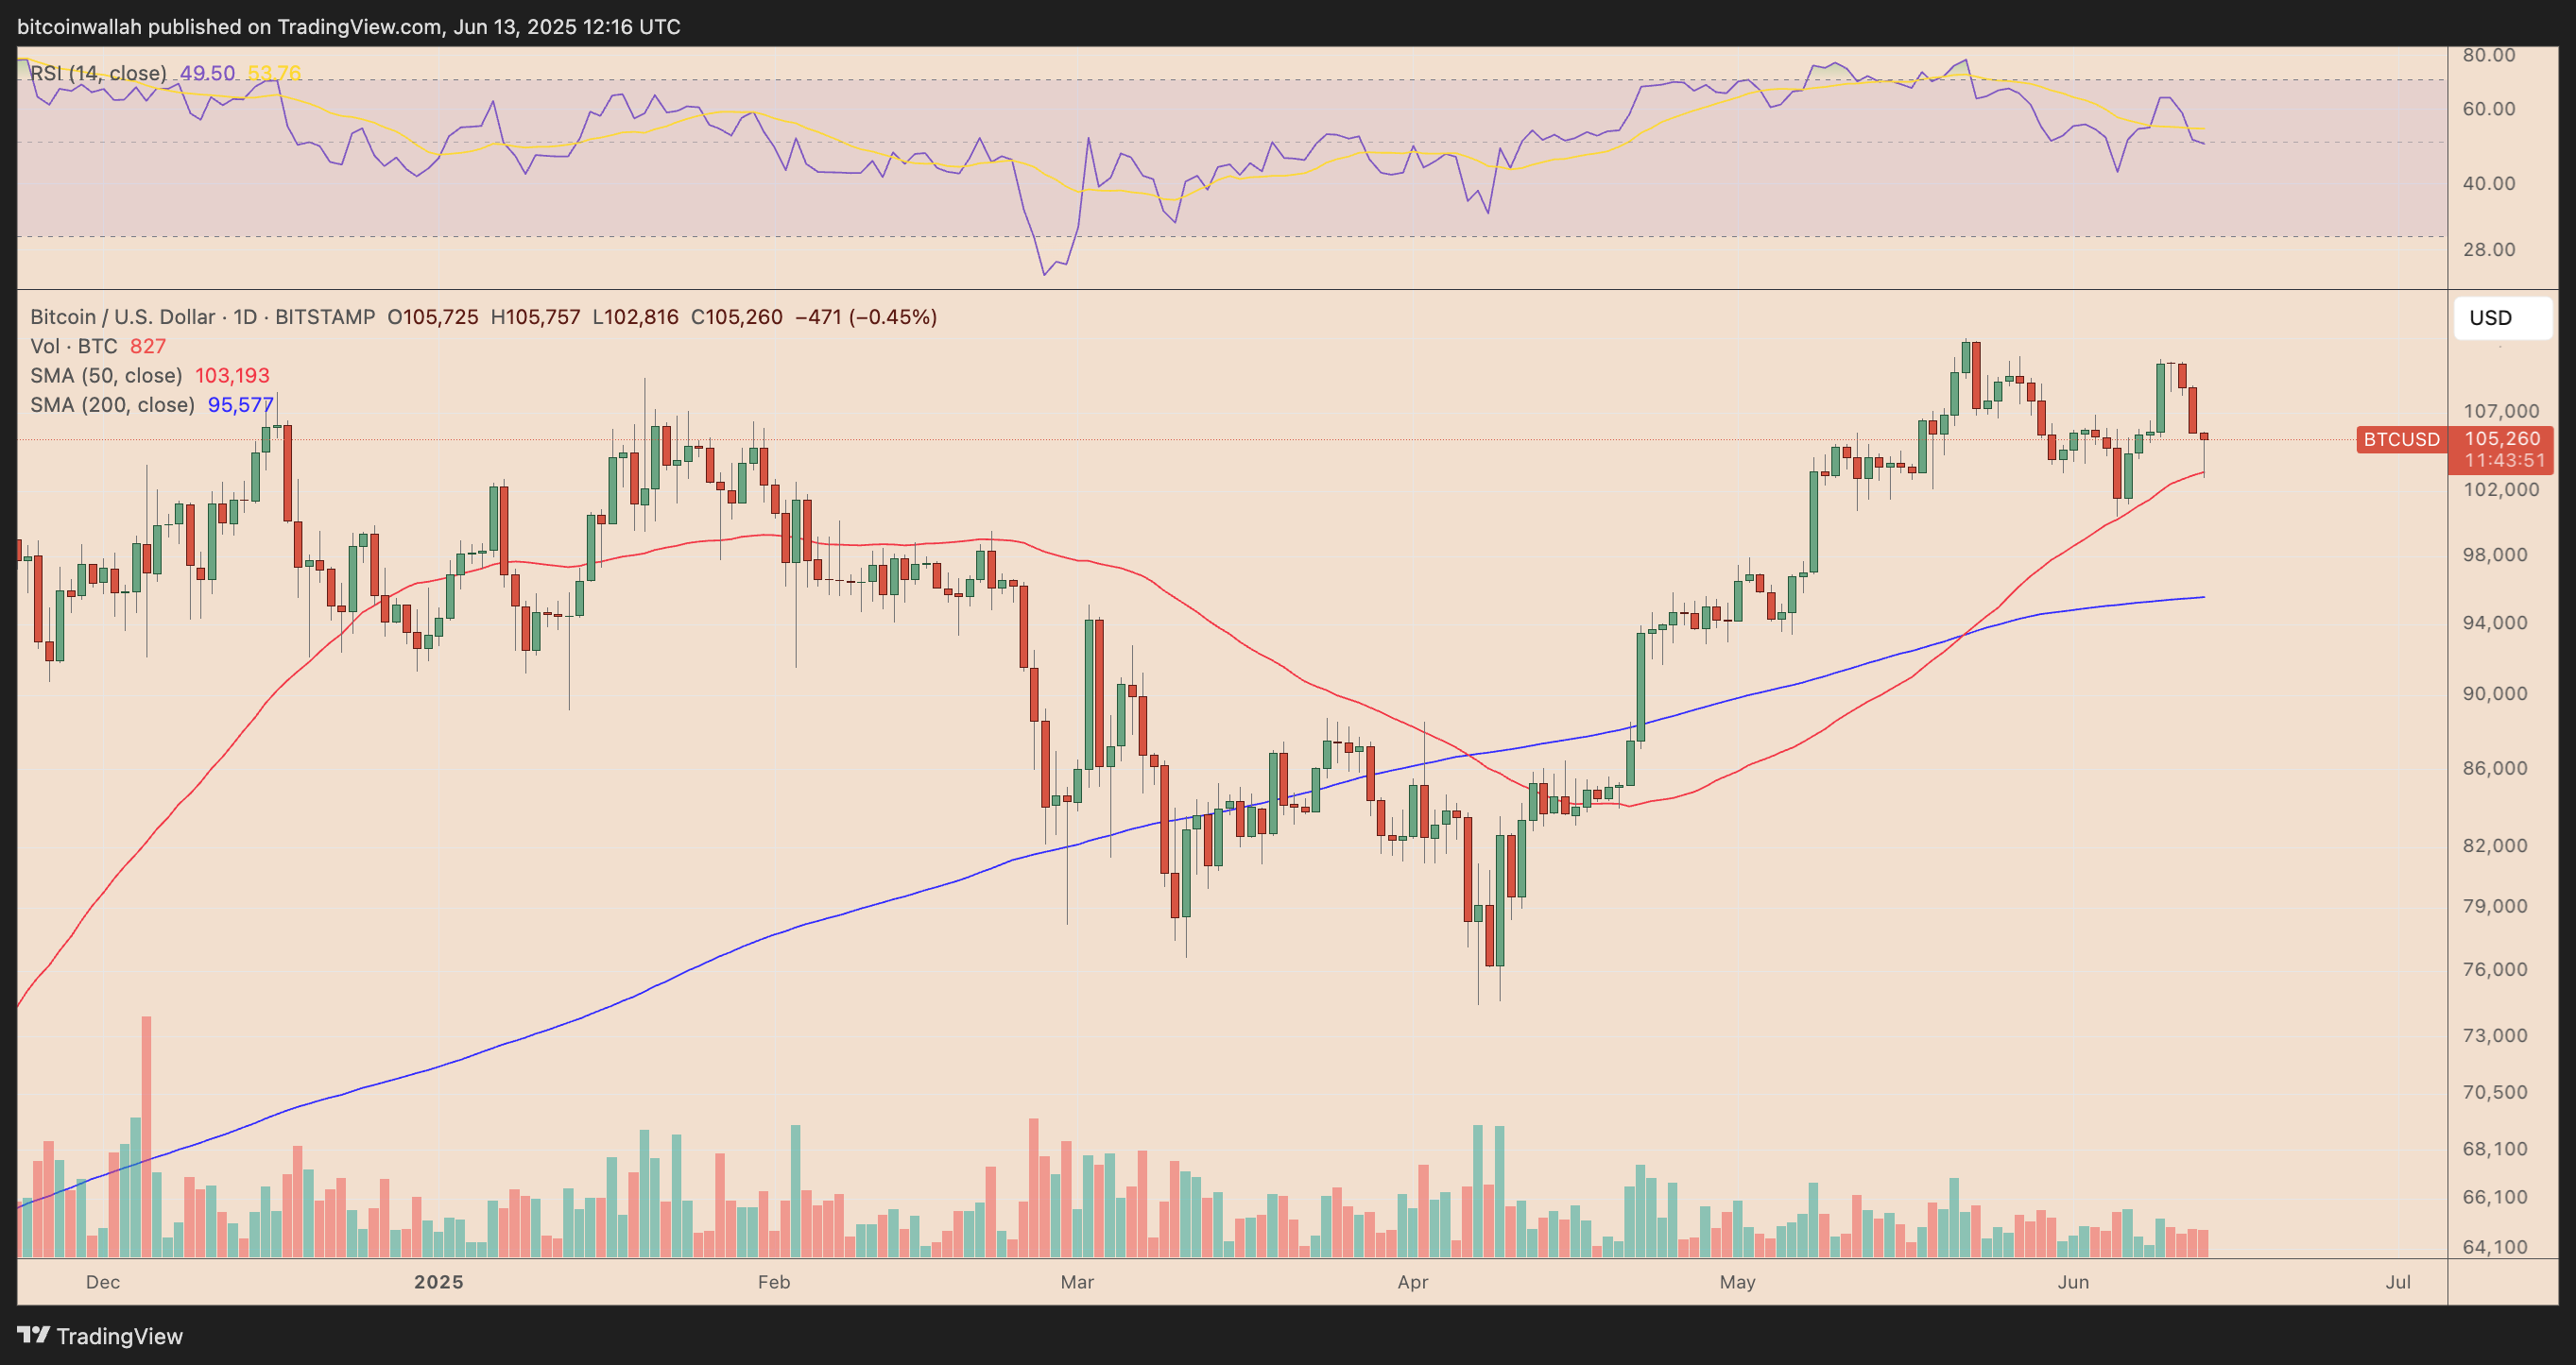
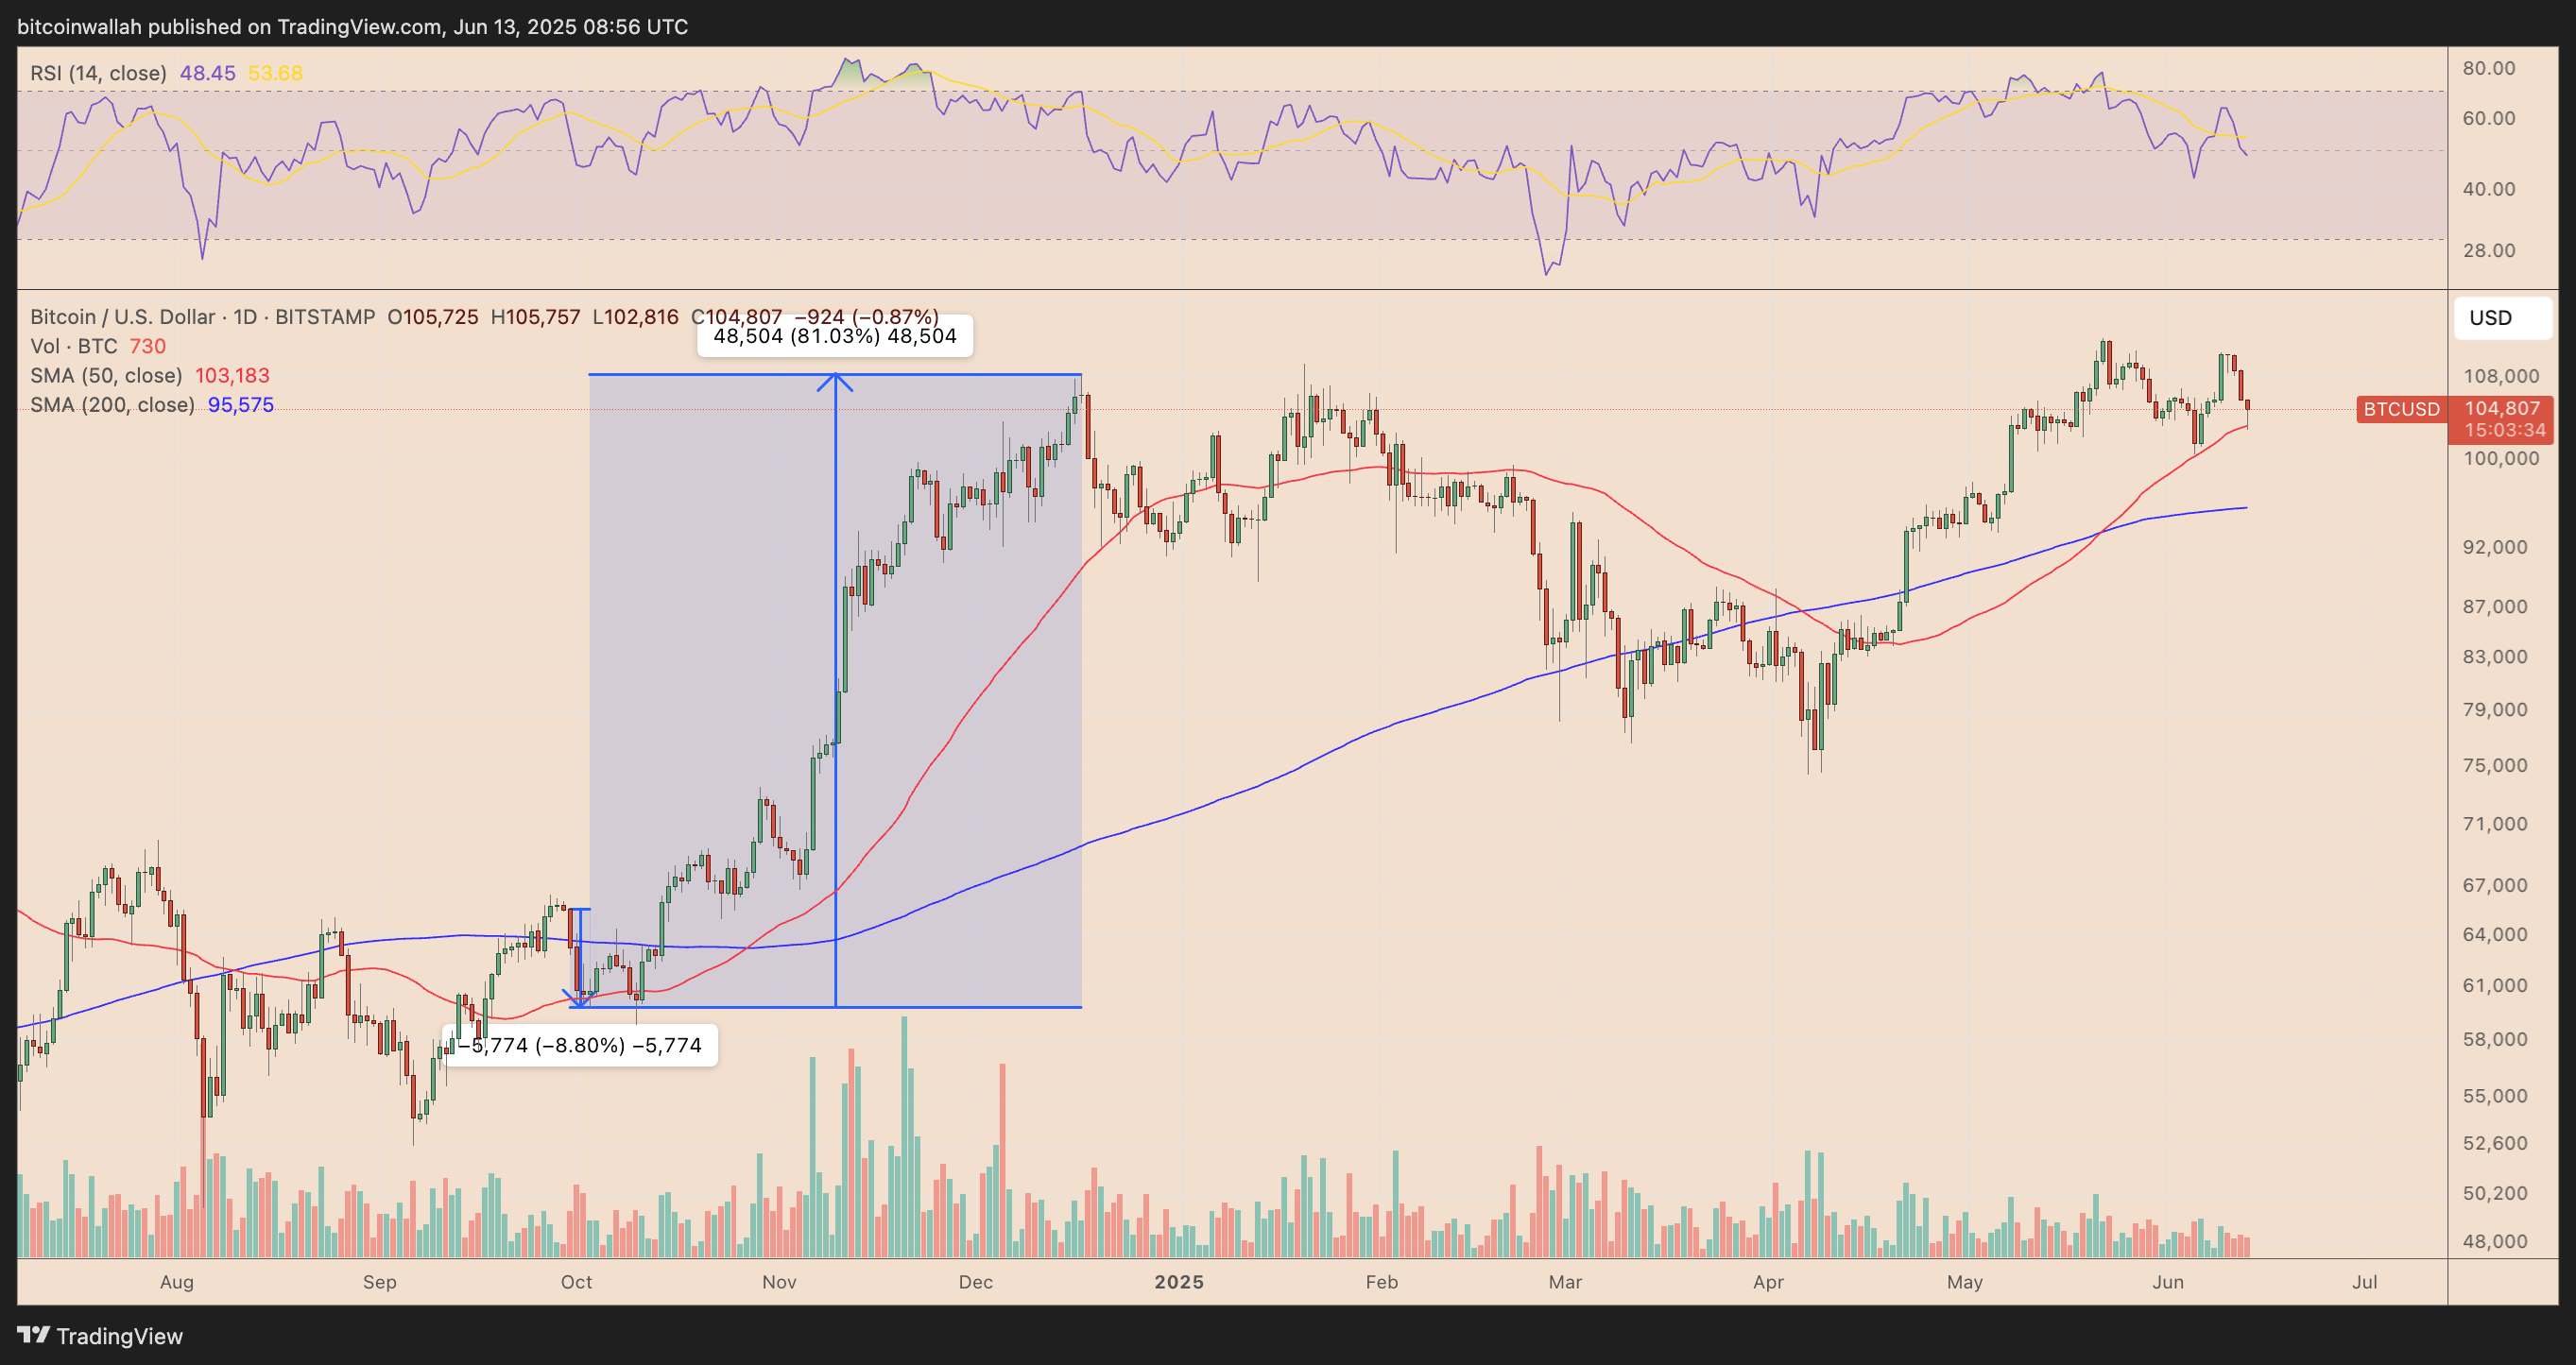
Bitcoin’s recent rebound appears to be more than just a knee-jerk reaction. The cryptocurrency found support near the same technical level that marked the start of its 80% rally in late 2024 — the 50-day simple moving average.
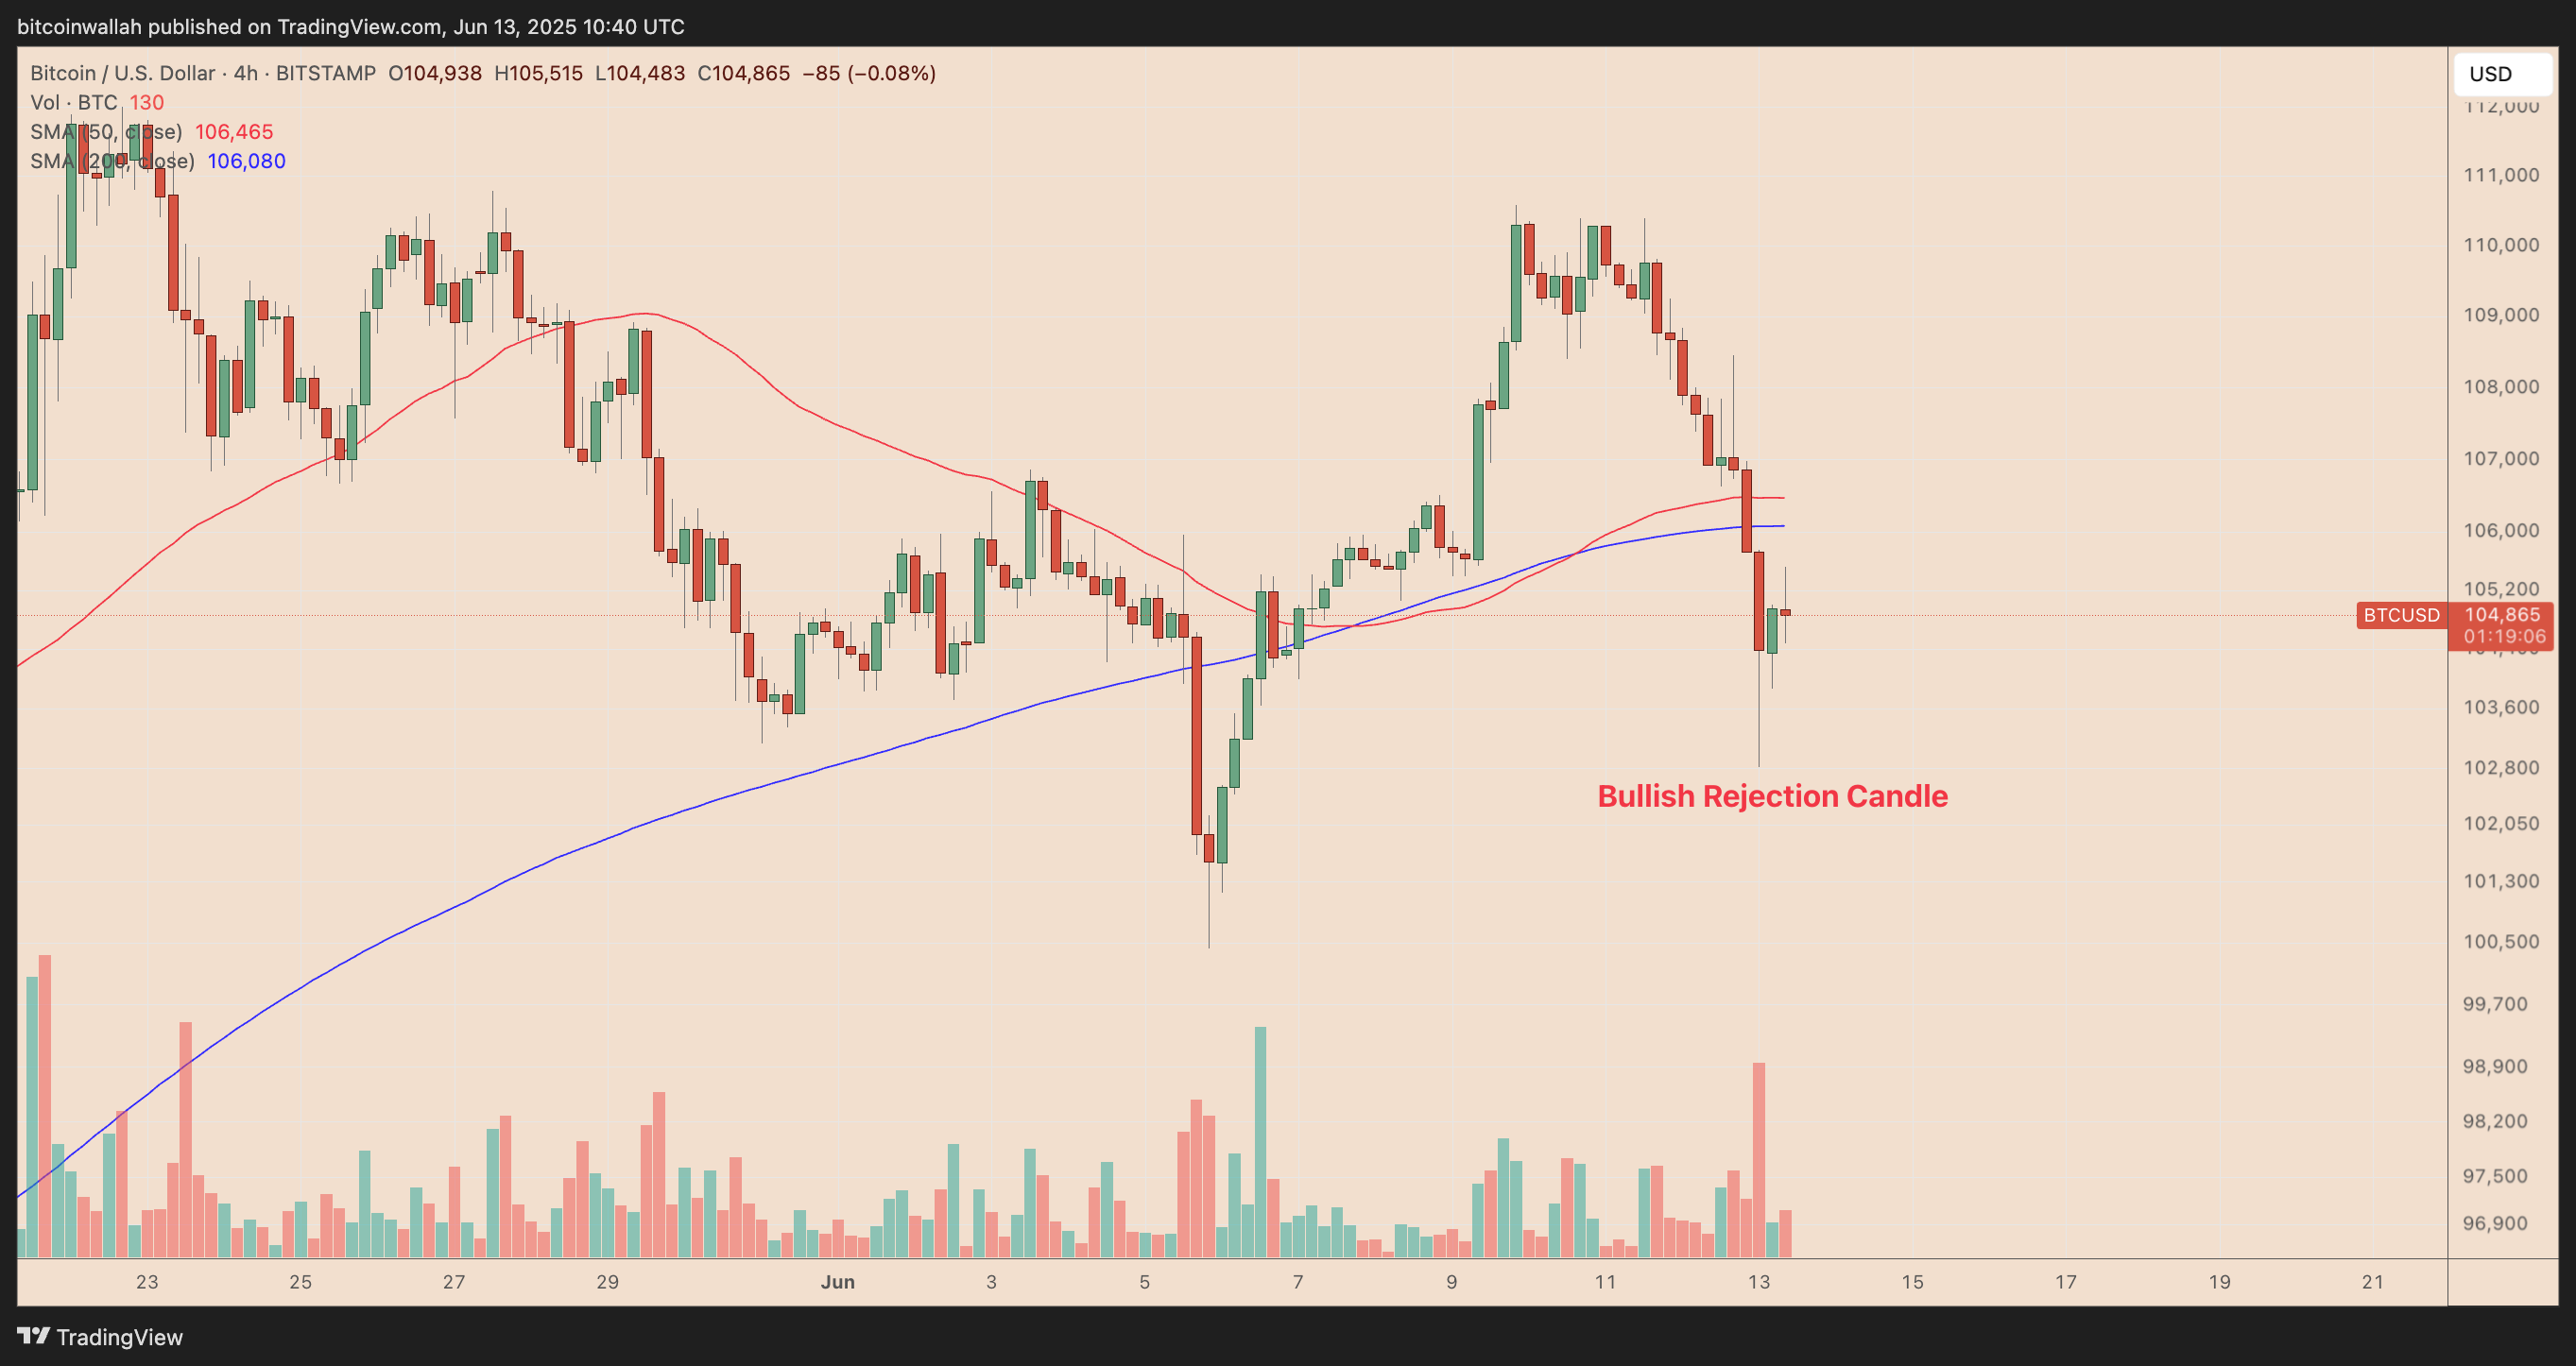
On June 13, BTC briefly fell to around $102,800 following news of Israel’s airstrikes on Iran. But the sell-off stalled as buyers stepped in near the moving average, a level that has historically acted as a launchpad during periods of heightened volatility.
The last time Bitcoin tested this support, in October 2024, also amid geopolitical tensions, it rallied sharply to a new all-time high within two months.
The repeat of this pattern has not gone unnoticed by traders, many of whom are watching to see whether the current bounce can once again evolve into a sustained breakout.
That includes Merlijn The Trader, who argues that Bitcoin is repeating a late-2024 breakout cycle that led its prices to a new record high of around $110,000.
We’ve seen this Bitcoin chart before.
Same structure. Same trap. Same breakout.In 2024, $BTC exploded after the liquidity grab.
In 2025, it’s setting up again.If you know the pattern, you know what comes next.
Smart money does. pic.twitter.com/wfINf5TLis
— Merlijn The Trader (@MerlijnTrader) June 13, 2025
Bitcoin could climb toward its year-end target of $150,000 if the fractal plays out as intended.
About the Author
Bob MasonChief Crypto Boss
123456789 30 He has written extensively for a broader audience and his current focus is on developments relating to the financial markets including, but not limited to currencies, commodities, alternative asset classes, and global equities.


Advertisement