
Advertisement
Advertisement
Bitcoin Outlook: Will US Labor Data Impact BTC After ETF Inflow Streak Ends?
By:
Key Points:
- Bitcoin holds above $60K despite a two-day 7.39% slide as broader crypto market suffers a 4.19% drop.
- Middle East conflict triggers risk-off sentiment, with investors pulling out of BTC as geopolitical tensions rise.
- BTC-spot ETF inflows extend an eight-day streak, adding $61.3M before a potential reversal on Tuesday.

In this article:
Bitcoin Avoids Sub-$60,000 Despite Sell-Off
On Tuesday, October 1, BTC slid 3.93%, following a 3.46% drop on Monday, to close at $60,874. BTC joined a broader crypto market sell-off, with the total crypto market cap declining by 4.19% to $2.090 trillion.
US BTC-spot ETF: Eight-Day Inflow Streak At Risk
On Monday, September 30, the US BTC-spot ETF market saw net inflows of $61.3 million, extending its inflow streak to eight sessions. The US BTC-spot ETF market recorded total net inflows of $1,262.8 million in September, supporting BTC’s 7.50% monthly gain.
However, the US BTC-spot ETF market’s eight-day inflow streak may end on Tuesday, October 1. According to Farside Investors,
- Fidelity Wise Origin Bitcoin Fund (FBTC) reported net outflows of 144.7 million.
- ARK 21Shares Bitcoin ETF (ARKB) saw net outflows of $84.3 million on Tuesday.
- Bitwise Bitcoin (BITB) had net outflows of $32.7 million.
- VanEck Bitcoin Trust (HODL) saw net outflows of $15.8 million.
- Grayscale Bitcoin Trust (GBTC) reported net outflows of $5.9 million.
Excluding flow data for iShares Bitcoin Trust (IBIT), the US BTC-spot ETF market saw net outflows of $283.4 million.
Middle East Conflict Fuels Flight to Safety
On Tuesday, investors reacted to news of an Iranian missile strike on Israel. According to media reports, the US condemned the attack and entered into talks with Israel on a possible response. The threat of a further escalation in the Middle East conflict adversely impacted demand for riskier assets, including US BTC-spot ETFs.
Notably, the Nasdaq Composite Index ended the Tuesday session down 1.53%.
US JOLTs Job Openings Report Eases Hard Landing Fears
On Tuesday, US labor market data further supported expectations of a soft US economic landing. The JOLTs Job Openings Report showed openings rise from 7.711 million in July to 8.040 million in August.
Higher job openings may reduce unemployment, possibly boosting wage growth and consumer spending. Upward trends in consumer spending could bolster the US economy as it contributes over 60% to GDP. However, a resilient US labor market and economy could reduce expectations of aggressive Fed rate cuts, adversely impacting demand for BTC.
US Economic Calendar and Its Impact on BTC
On Wednesday, October 1, US labor market data will be in focus, with ADP employment figures likely to draw investor interest. Economists predict the ADP will report a 120k increase in September, up from 99k in August.
Better-than-expected numbers may ease expectations of aggressive Fed rate cuts, possibly reducing demand for riskier assets. Beyond the numbers, investors should monitor FOMC member commentary and news updates on the Middle East conflict.
Investors should remain alert, with upcoming US economic indicators, and updates from the Middle East. Traders may also want to monitor ETF inflows closely in the coming days as they could impact short-term demand for BTC and the broader market. Stay updated with our latest news and analysis to manage your BTC and crypto exposures.
Technical Analysis
Bitcoin Analysis
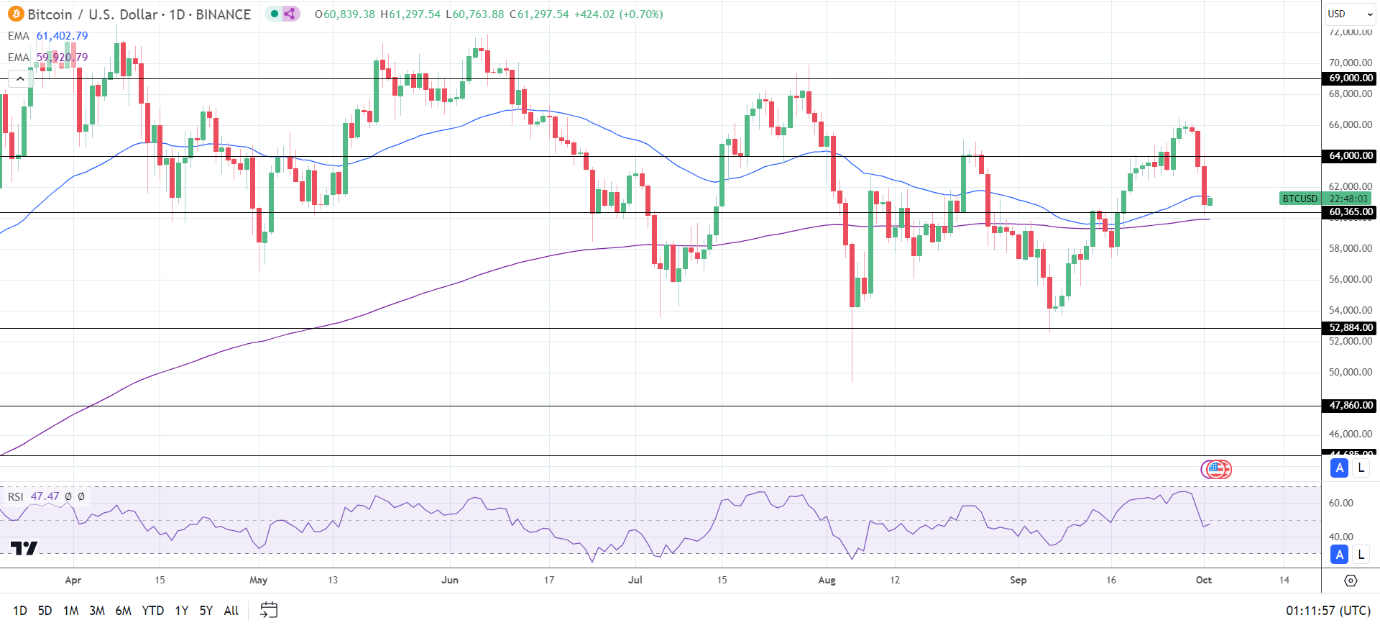
BTC hovers below the 50-day EMA while holding above the 200-day EMA, sending bearish near-term but bullish longer-term price signals.
Will Bitcoin break above $64,000 with upcoming economic data? Here’s what to watch.
A break above the 50-day EMA would support a move toward the $64,000 resistance level. Furthermore, a breakout from the $64,000 resistance level could give the bulls a run at the September 27 high of $66,520.
Investors should consider the US economic calendar, news from the Middle East, and US BTC-spot ETF market flows.
Conversely, a fall through the $60,365 support level may bring the 200-day EMA into play. A break below the 200-day EMA would affirm a bullish trend reversal, supporting a BTC drop toward $55,000.
With a 47.47 14-day RSI reading, BTC could drop to $55,000 before entering oversold territory.
Ethereum Analysis
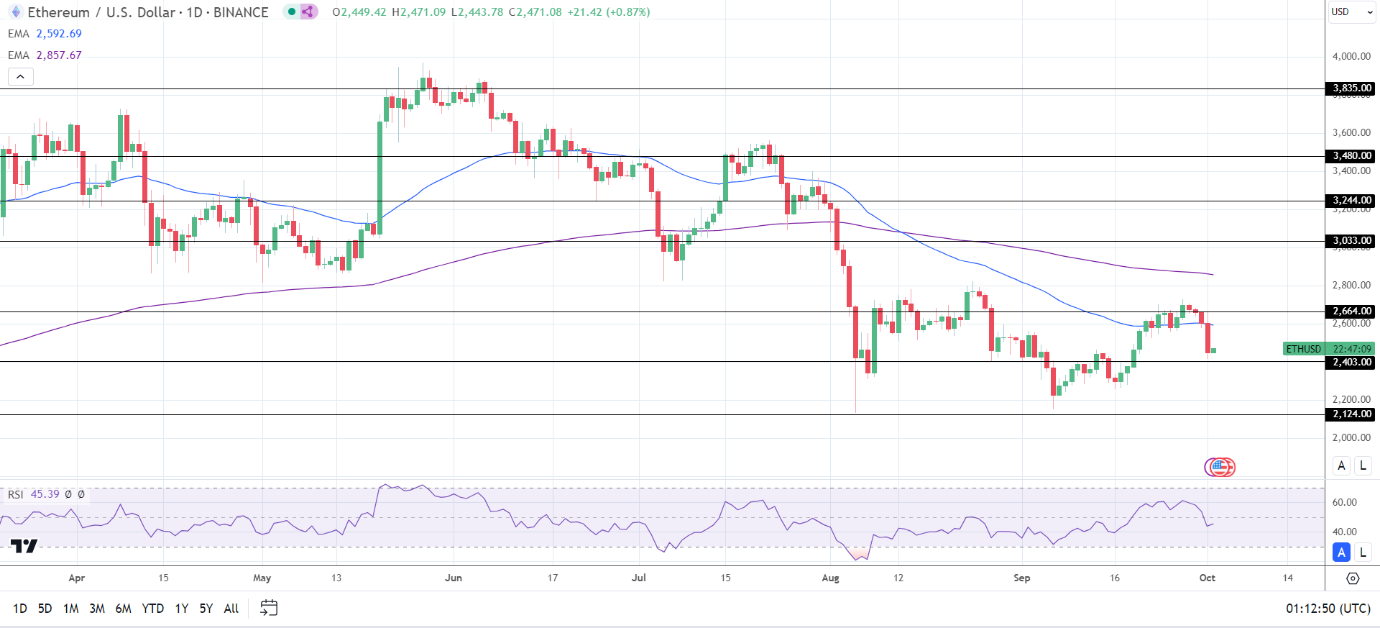
ETH hovers below the 50-day and 200-day EMAs, sending bearish price signals.
An ETH return to $2,500 would support a move toward the $2,664 resistance level. Furthermore, a break above the $2,664 resistance level may give the bulls a run at the $2,800 level.
US ETH-spot ETF market-related updates also require consideration.
Conversely, an ETH fall through the $2,403 support level could signal a drop toward the $2,124 support level.
The 14-period Daily RSI reading, 45.39, indicates an ETH drop to the $2,124 support level before entering oversold territory.
About the Author
Bob MasonChief Crypto Boss
TEST 30 He has written extensively for a broader audience and his current focus is on developments relating to the financial markets including, but not limited to currencies, commodities, alternative asset classes, and global equities.
Latest news and analysis


Advertisement