
Advertisement
Advertisement
Bitcoin Price Dip Below $60K is Mirroring 50% Crash Pattern From 2021
By:
Key Points:
- Bitcoin's drop below $60,000 was triggered by fears of a potential $8.5 billion sell-off led by the latest Mt. Gox news.
- A fractal analysis suggests Bitcoin could fall further to around $50,000, reflecting a similar 50% crash pattern seen in May 2021.
- Despite concerns, some analysts believe the actual selling pressure from the Mt. Gox refund may be less severe than expected.

In this article:
On June 24, Bitcoin experienced a significant drop, falling below $60,000 for the first time in seven weeks. This decline was sparked by an announcement from the Mt. Gox trustee, who plans to refund 140,000 BTC to creditors affected by the infamous 2014 hack of the now-defunct exchange. The impending refund has fueled fears of a potential $8.5 billion market dump by the end of July, sending shockwaves through the crypto community.
Adding to the bearish sentiment, a fractal analysis of Bitcoin’s weekly chart indicates a strong probability of further decline. The analysis suggests that BTC could fall towards $50,000 in the coming weeks, potentially reaching this level by the end of July. Let’s discuss it further.
Bitcoin’s Drop Below $60,000 is Mirroring a 50% Crash Pattern From May 2021
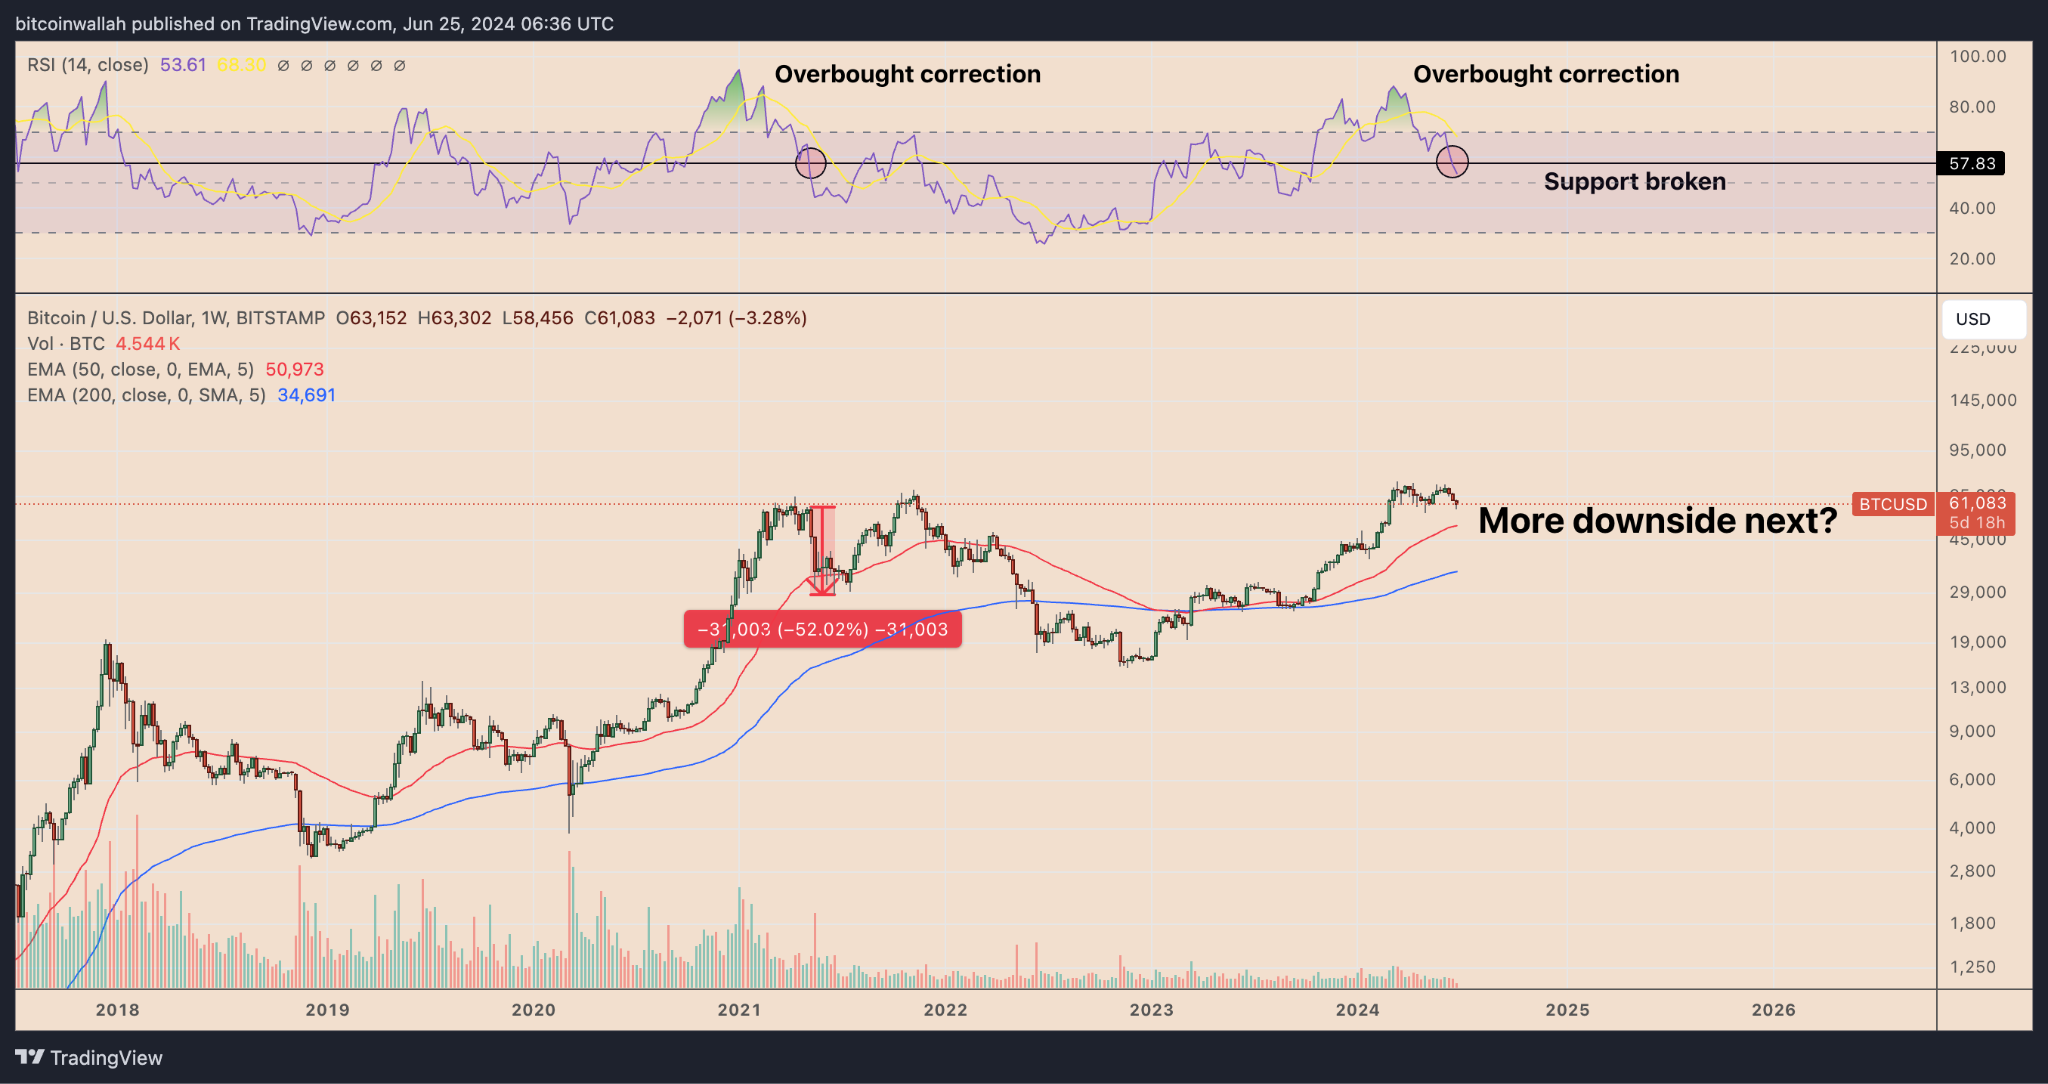
The recent drop in Bitcoin prices below $60,000 closely mirrors a fractal pattern observed in May 2021, which saw a 50% plunge. This fractal involves these key indicators: the 50-week (red line) and 200-week (blue line) exponential moving averages (EMA), along with the weekly Relative Strength Index (RSI).
May 2021 Fractal Analysis:
- Overbought Correction: In May 2021, Bitcoin experienced an overbought correction after the weekly RSI surged above 70.
- Short-term Recovery: On April 19, there was a slight price recovery, accompanied by a small bounce in the RSI. This formed a short-term support level near 57.83 on the RSI.
- Bearish Continuation: Despite the brief recovery, the market remained bearish. The RSI eventually broke below the 57.83 support level, leading to further price declines toward the 50-week EMA.
Current Scenario:
- Price Drop Below $60,000: Bitcoin’s current price drop below $60,000 resembles the May 2021 fractal.
- RSI and EMA Indicators: Similar to the past pattern, the current RSI has broken below the 57.83 support level. This suggests potential further downside, with the 50-week EMA acting as the next support level.
Therefore, if the May 2021 fractal plays out as intended, BTC’s next downside target during the ongoing price correction is around $50,000, down about 20% from the current price levels.
Bitcoin Sell-Side Pressure is A Real Trouble
Bitcoin’s Spot Cumulative Volume Delta (CVD) metric—which measures the net bias in market-taker buy versus sell volume—indicates that the spot market is dominated by a net sell-side bias. However, the market overall is still trending sideways, showing that the demand-side pressure is roughly equal to the sell-side pressure.
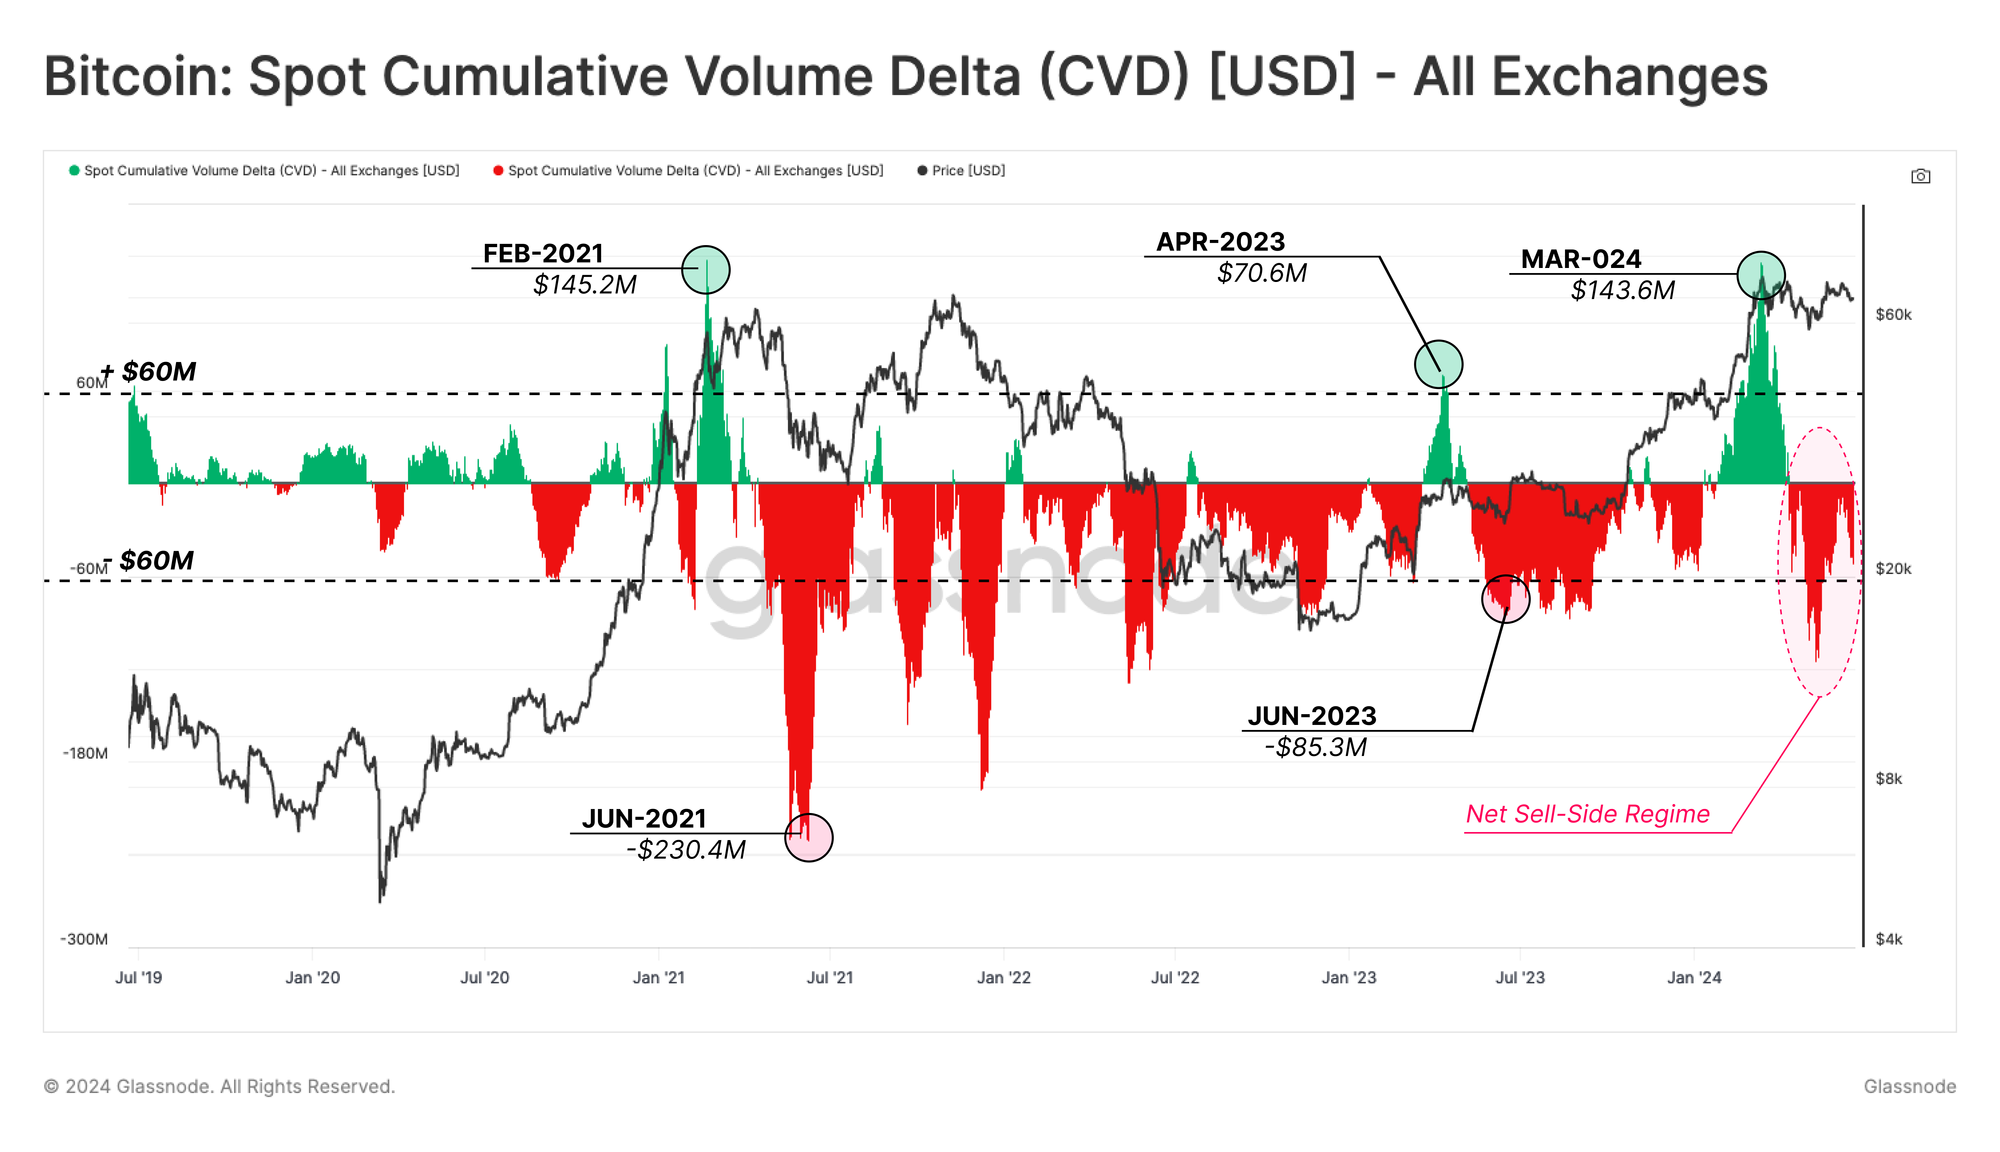
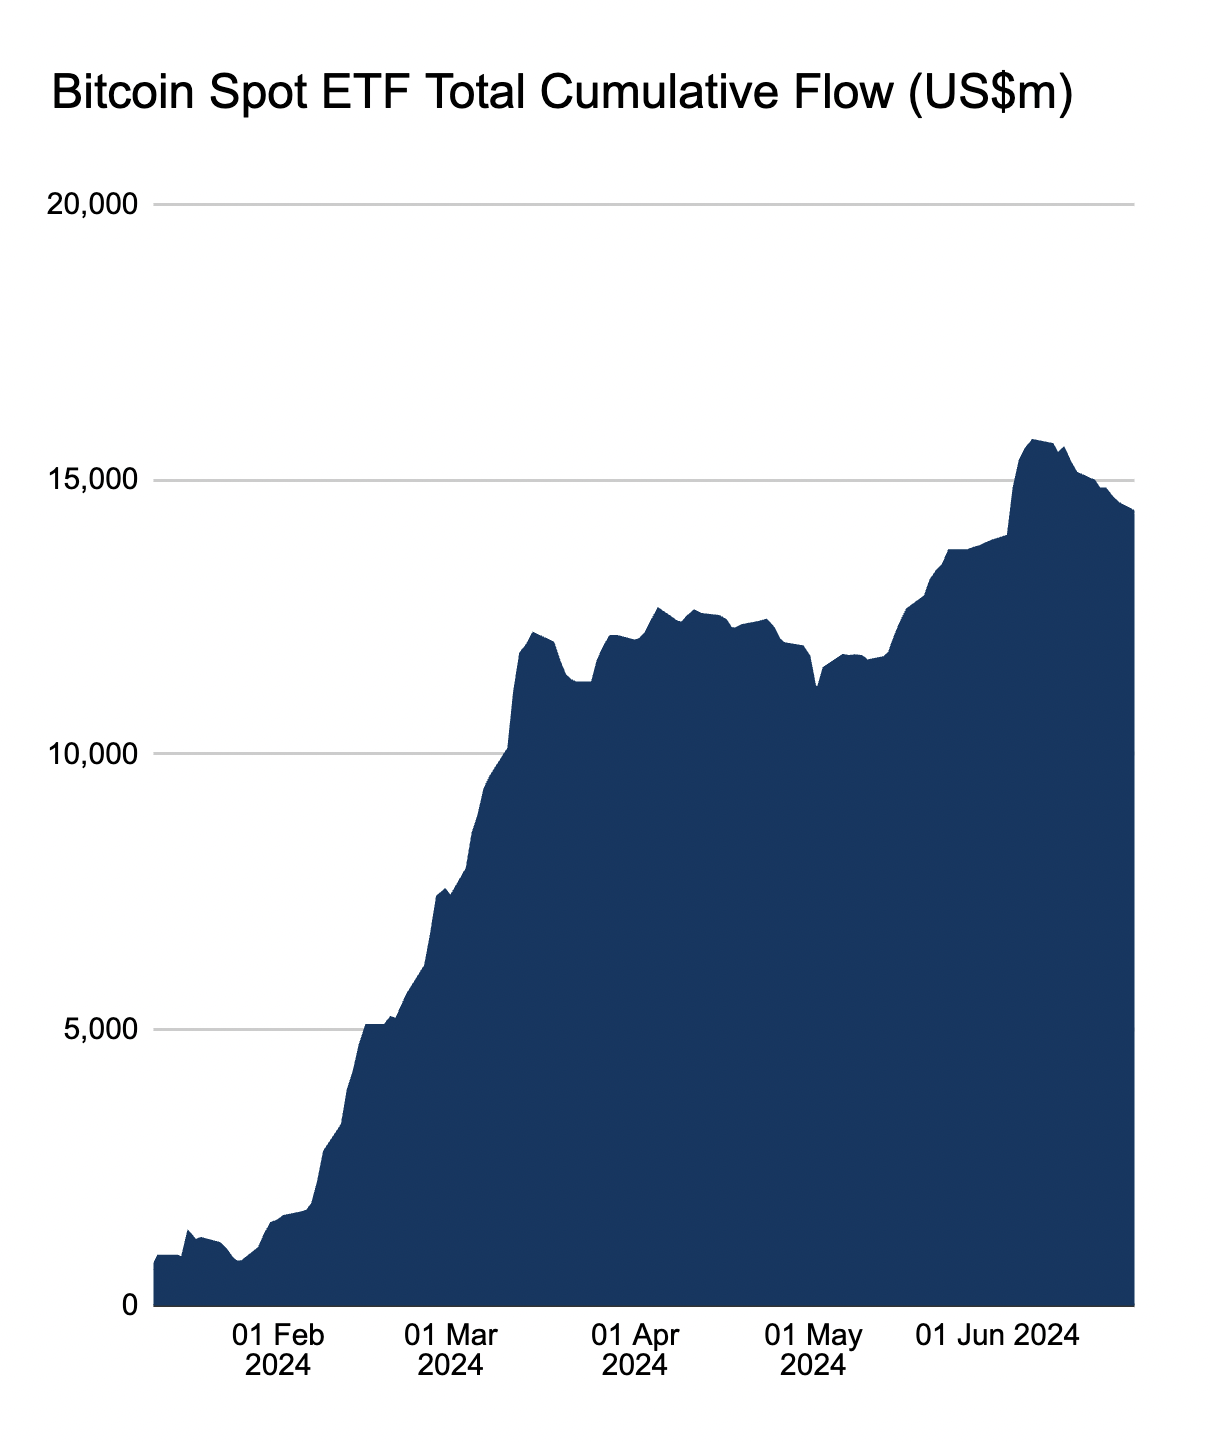
However, this balance between buyers and sellers may not last if the Mt. Gox beneficiaries start dumping their recovered tokens. Such an influx of selling pressure, coupled with the recent back-to-back daily outflows from Bitcoin exchange-traded funds (ETF), could disrupt the equilibrium and drive prices lower.
Top Analyst Disagrees With Mt. Gox Dump FUD
Those who have sold Bitcoin after the Mt. Gox news update contemplate the impact of over 140,000 BTC hitting the market within a month. To put that in perspective, it would be slightly less than the immediate liquidation of Fidelity’s spot Bitcoin ETF, which recently held 167,375 Bitcoin.
However, Alex Thorn, head of research at Galaxy, disagrees with the scenario of an $8.5 billion Bitcoin dump, saying that “fewer coins will be distributed than people think and that it will cause less Bitcoin sell pressure than the market expects.”
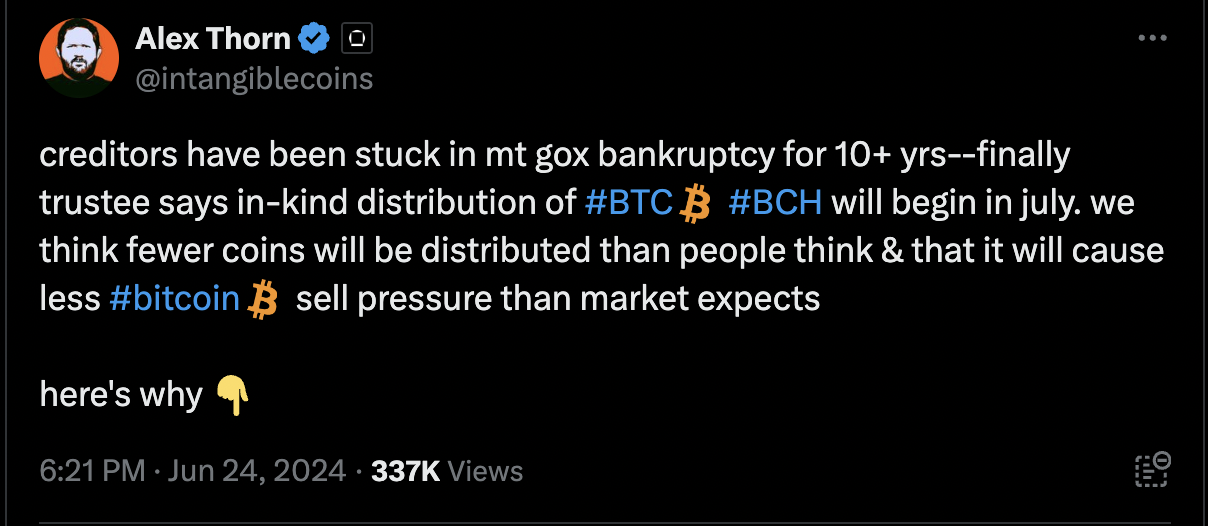
Thorn’s research suggests that 75% of creditors will opt for the “early” payout in July, resulting in the distribution of about 95,000 coins. Of those, Thorn believes 65,000 will go to individual creditors, who may prove more “diamond-handed” than anticipated.
He points out that these creditors have already resisted years of compelling and aggressive offers from claims funds, not to mention the capital gains taxes involved, given Bitcoin’s 140-fold increase since the bankruptcy.
As for the claims funds, Thorn notes that most partners in these funds are high-net-worth Bitcoiners aiming to increase their holdings at a discount rather than arbitrageurs seeking a quick profit. This nuanced view suggests that the selling pressure may be less severe than initially feared, but the market remains watchful as the distribution approaches.
As of June 25, Bitcoin’s price had recovered to as high as $61,590.
About the Author
Bob MasonChief Crypto Boss
TEST 30 He has written extensively for a broader audience and his current focus is on developments relating to the financial markets including, but not limited to currencies, commodities, alternative asset classes, and global equities.
Latest news and analysis


Advertisement