
Advertisement
Advertisement
Bitcoin Price News: BTC Recovers After Iran Attacks U.S. Airbase – Is It a War Safe Haven?
By:
Key Points:
- A U.S. airbase in Qatar was attacked by an Iranian missile and Bitcoin surged right after.
- The daily chart shows that support is strong at $100,000.
- An inverse head-and-shoulders pattern has emerged in the hourly chart that could anticipate a push to $109K.

Bitcoin (BTC) has booked gains of 3.2% in the past 24 hours and has managed to stay above the $100,000 level despite the weekend’s sell-off.
Just a couple of hours ago, reports started to come in about a targeted attack from Iran on the Al-Udeid air base in Qatar. This is a facility that hosts U.S. air forces for fast deployment in the region.
The attack is interpreted as Iran’s retaliation against the United States after the latter bombed and destroyed three of its most important uranium enrichment facilities and nuclear energy research hubs.
Right after media outlets started to report the attack, the price of Bitcoin (BTC) rapidly surged. The token had been recovering throughout the day and is now on track to surpass the $103,000 mark after bouncing off $100,000 with some strong volumes.
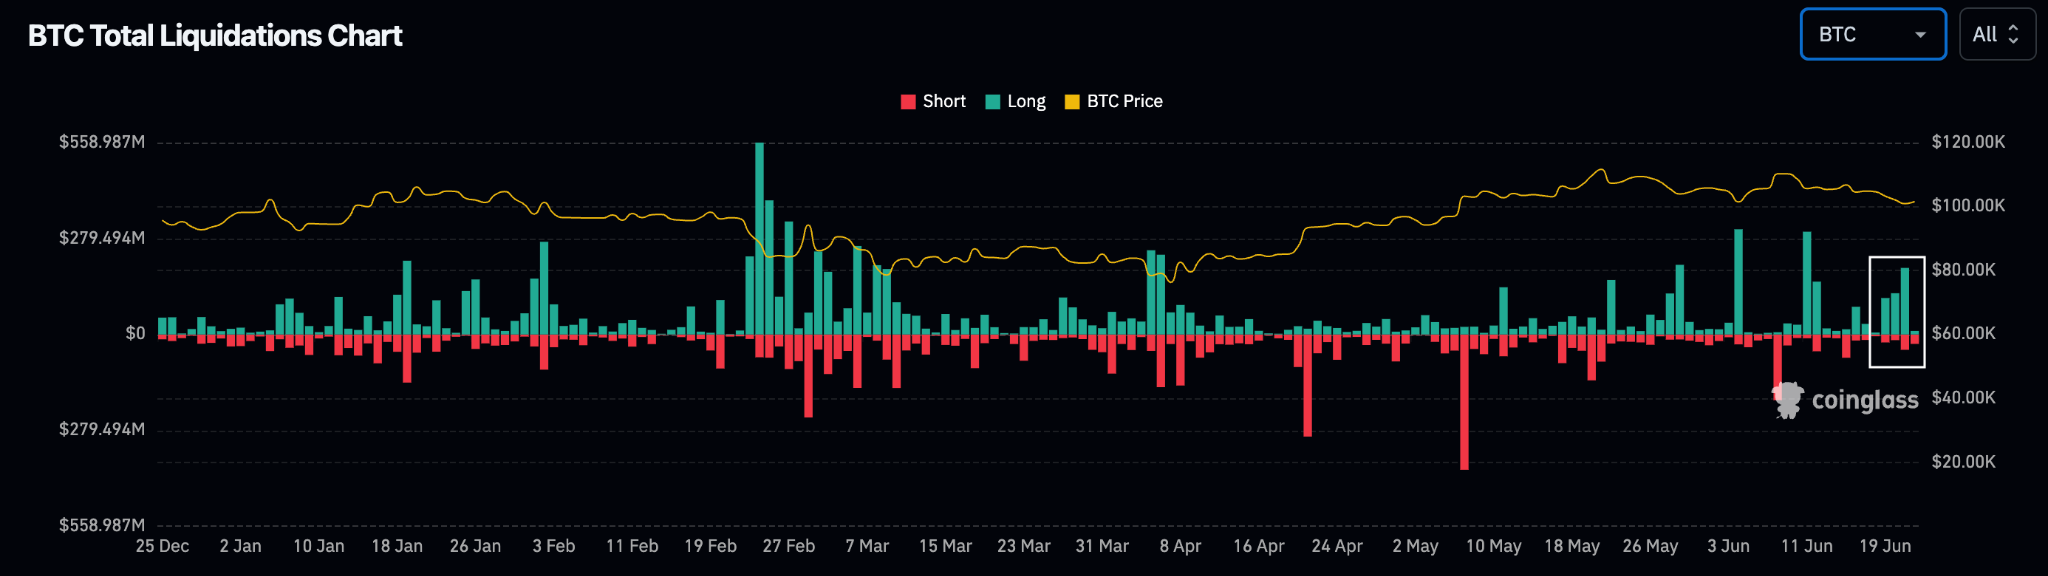
Short positions were thriving during the weekend but were hammered in the past hour after this event. Data from CoinGlass shows that $25 million worth of shorts have been wiped out already since the news came out.
Meanwhile, the same amount of short and long positions – around $220 million each – have been flushed out of the crypto market in the past 24 hours.
During the weekend, $419 million worth of Bitcoin long positions were liquidated as cryptos plummeted following the U.S. attack on Iranian facilities.
Now, with bombs dropping on U.S. infrastructure in the Middle East for the first time, is the market changing its mind and choosing Bitcoin as its preferred safe haven?
BTC Bounces Off $100K For a Third Time
Looking at the daily chart, this is the third time that Bitcoin has touched the $100,000 mark since May 12. In all of the prior occasions, it has resulted in a lower high, meaning that buyers’ interest is waning.
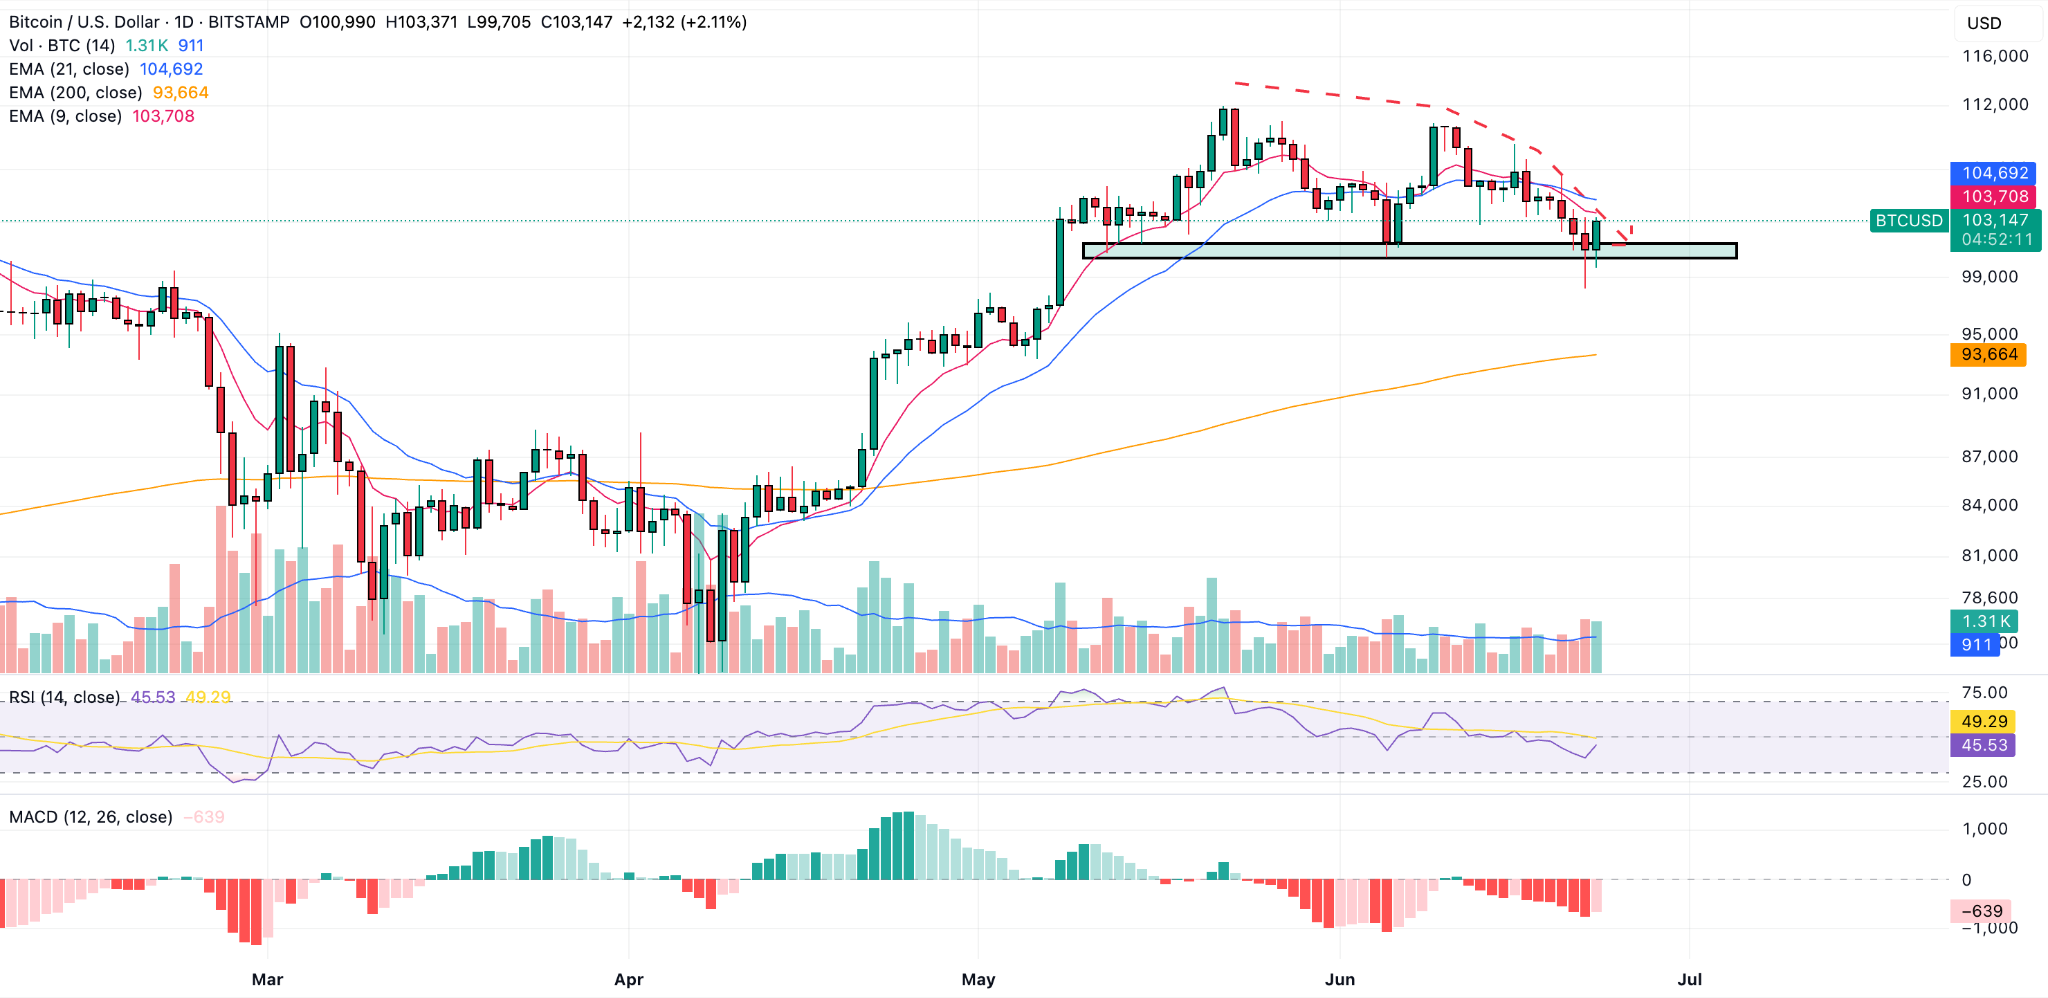
BTC/USD Daily Chart (Bitstamp) – Source: TradingView
The 9-day and 21-day EMAs have made a bearish crossover known as a ‘death cross’ that tends to anticipate an upcoming decline in the price.
Thus far, a downtrend has not yet been confirmed as a bearish breakout below the $100,000 level would have to take place for that to happen. However, the ingredients are in there.
Bitcoin is currently trading above the 200-day EMA, which still supports a bullish long-term outlook for the token.
Inverse Head and Shoulders Pattern Pop Up in The Hourly Chart
Heading to the hourly chart, we can see that Bitcoin has formed what seems to be a bullish inverse head and shoulders pattern that could result in significant short-term gains for the top crypto.
The neckline currently sits at $103,443 and we can see that the token found strong support once it got to $100,000 – a key psychological threshold.
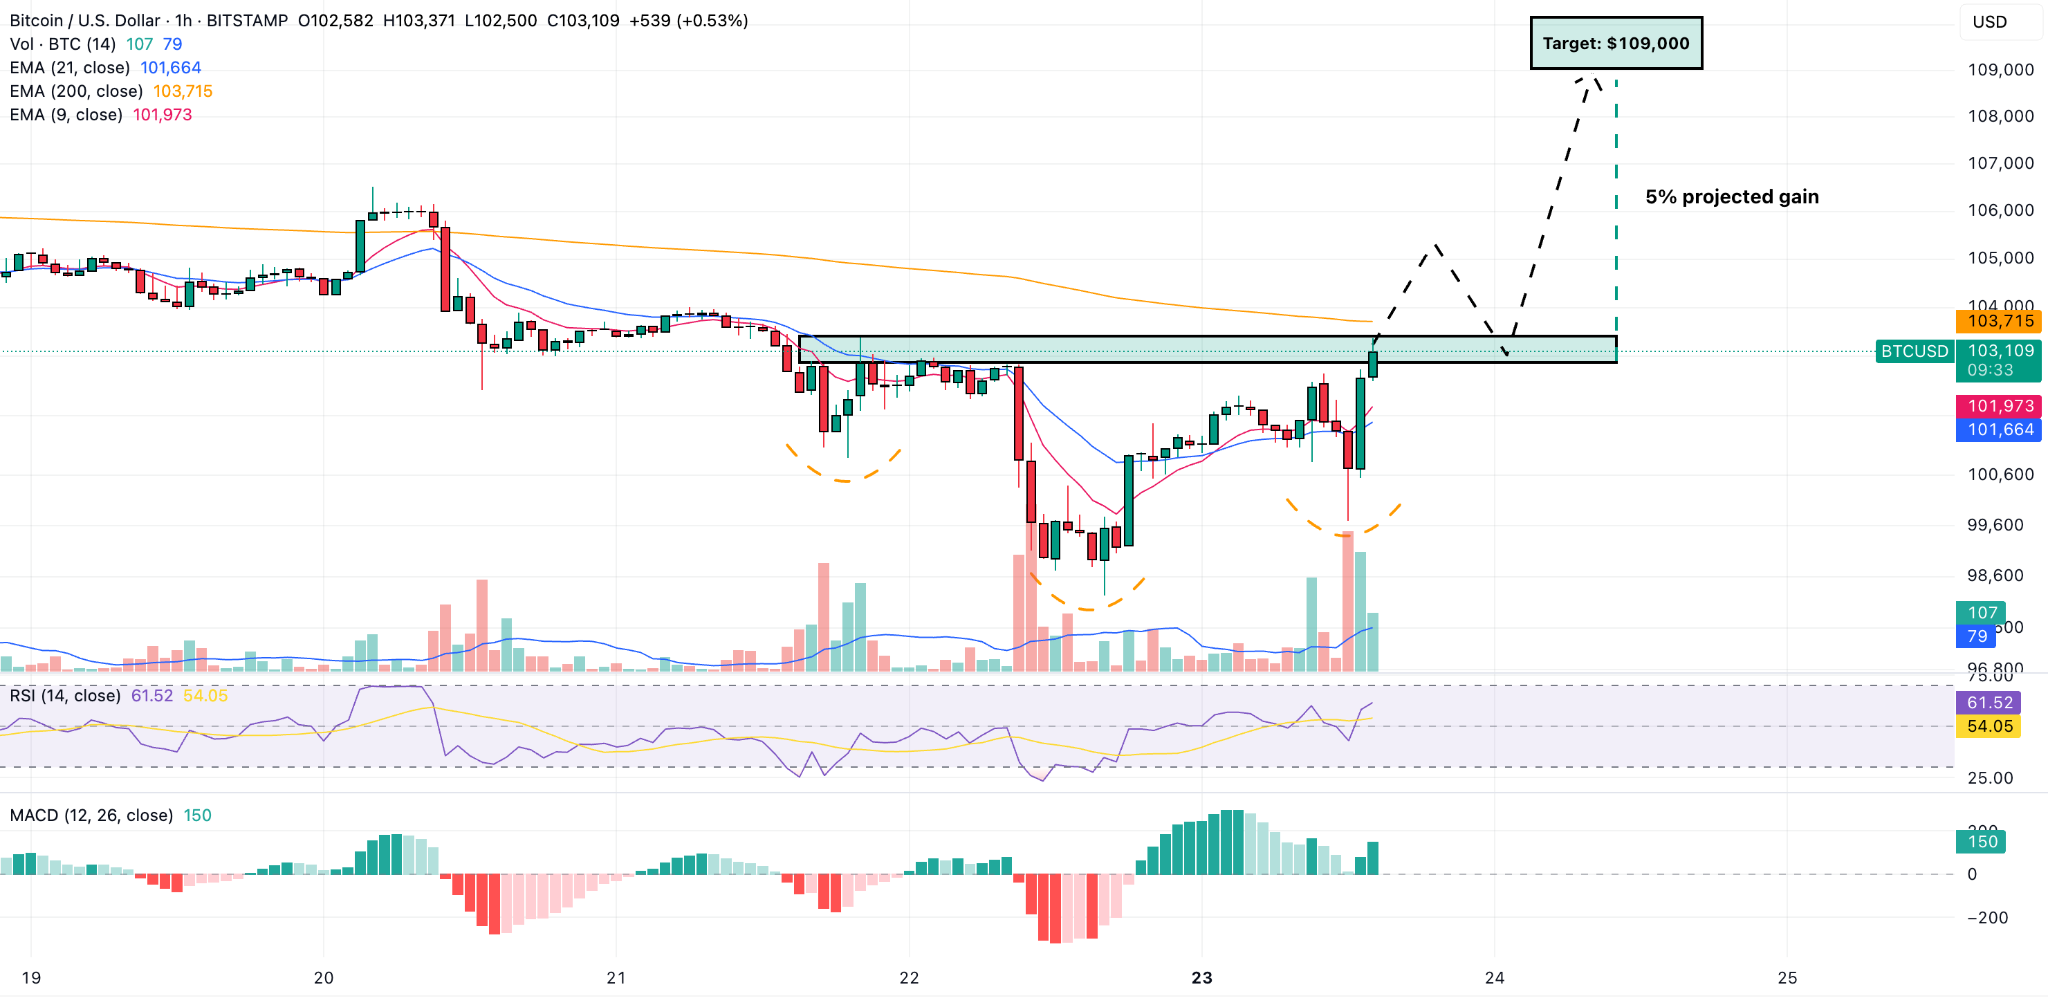
BTC/USD Hourly Chart (Bitstamp) – Source: TradingView
If the price rises above $103,500 we will get the first confirmation of this pattern’s bullish bias. Next up, the price will have to retest that level to confirm its relevance to market participants.
If it does and the price bounces off that level, it could mean that BTC is eyeing the $109,000 area next as this is the projected target based on the size of the head, which constituted a 5% dro
About the Author
Bob MasonChief Crypto Boss
123456789 30 He has written extensively for a broader audience and his current focus is on developments relating to the financial markets including, but not limited to currencies, commodities, alternative asset classes, and global equities.


Advertisement