
Advertisement
Advertisement
Cardano (ADA) At Key Turning Point As It Reached Symmetrical Triangle Apex
By:
Key Points:
- Descending wedge formation suggests impending breakout.
- Key Fibonacci levels dictate crucial support and resistance.
- Elliott Wave count nearing completion of corrective structure.

Cardano (ADA) is currently trading within a descending channel formation, exhibiting both consolidation and corrective price action. The asset has tested significant Fibonacci retracement levels, hinting at a potential reversal or continuation of its downward movement. Elliott Wave counts suggest ADA is in the later stages of a corrective pattern, with a decisive breakout likely to determine its next major move.
ADA Price Analysis
The 4-hour chart highlights ADA’s prolonged corrective movement after reaching a peak at $1.306. Since then, the price has been declining within a descending wedge, with a potential ABC correction forming. The completion of Wave C at the $0.530 region previously led to a short-term recovery, but price action remains constrained below the 0.5 Fibonacci retracement at $0.812.
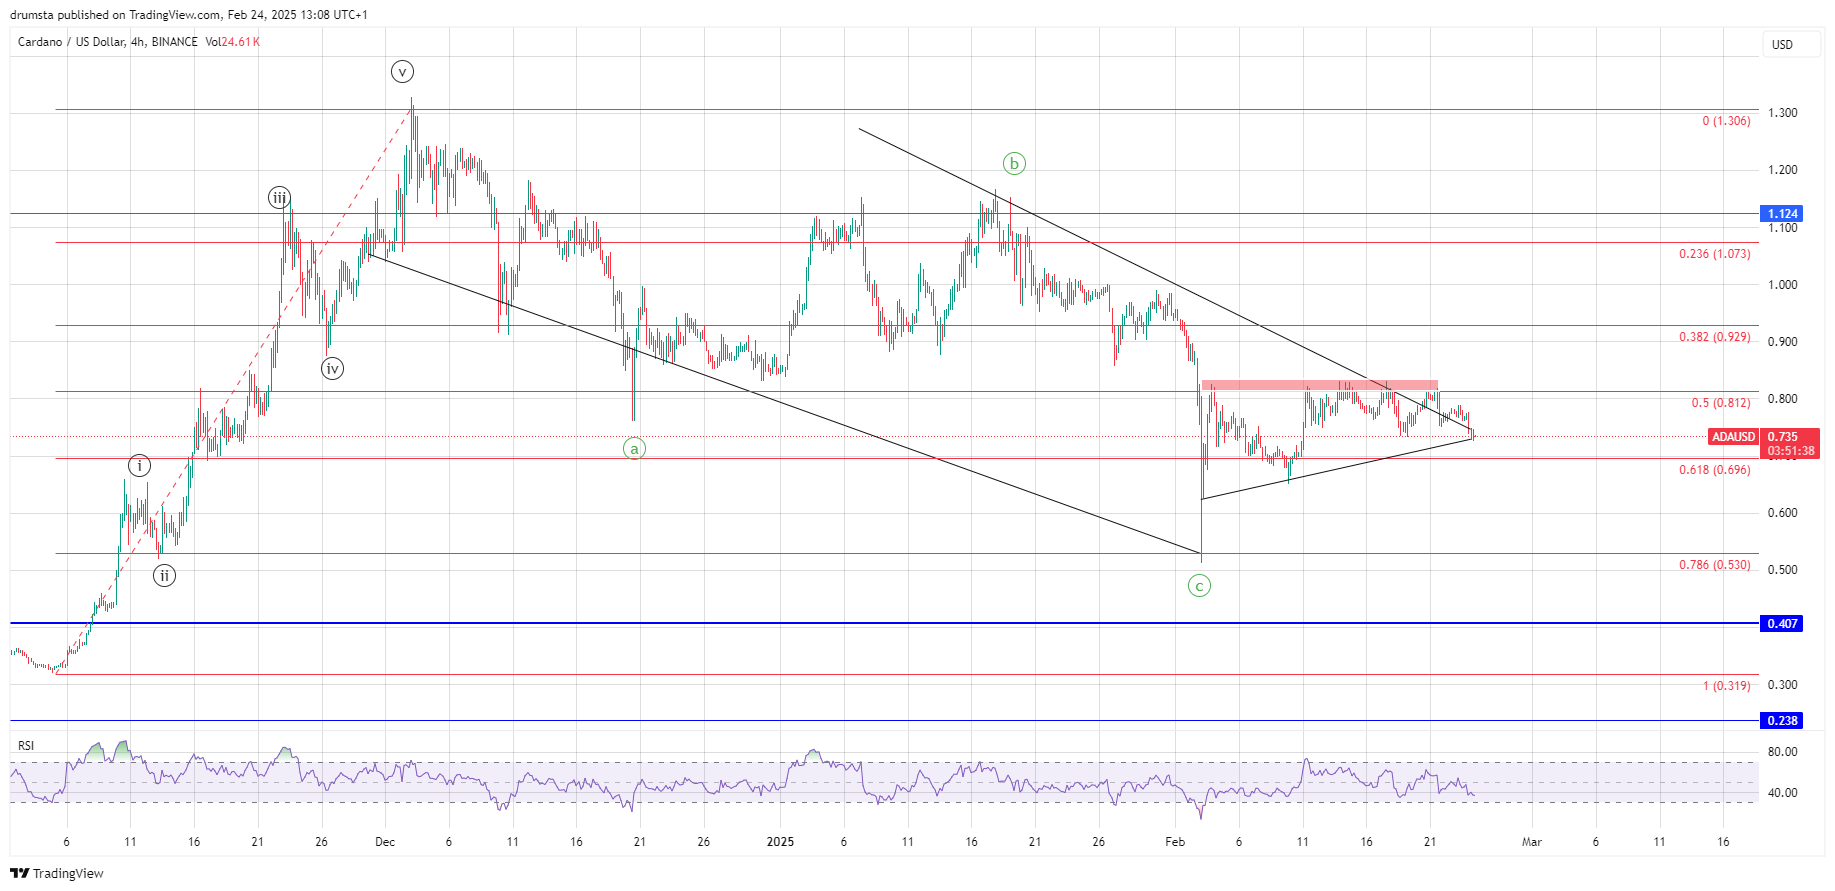
Currently, ADA is consolidating near the 0.618 Fibonacci level at $0.696, which has acted as a crucial support area. A failure to hold this level could see the price revisiting the 0.786 retracement at $0.530. The RSI on the 4-hour timeframe is hovering near the 40-mark, reflecting weakened bullish momentum but not yet oversold conditions.
The downward trendline from previous highs remains a key resistance level. A breakout above $0.812 (0.5 Fibonacci) would indicate a trend reversal, targeting higher resistances near $0.929 (0.382 Fibonacci) and ultimately $1.073 (0.236 Fibonacci). However, a breakdown from current support levels could confirm a continued corrective phase, pushing the price lower before a potential wave reversal.
ADA Price Prediction
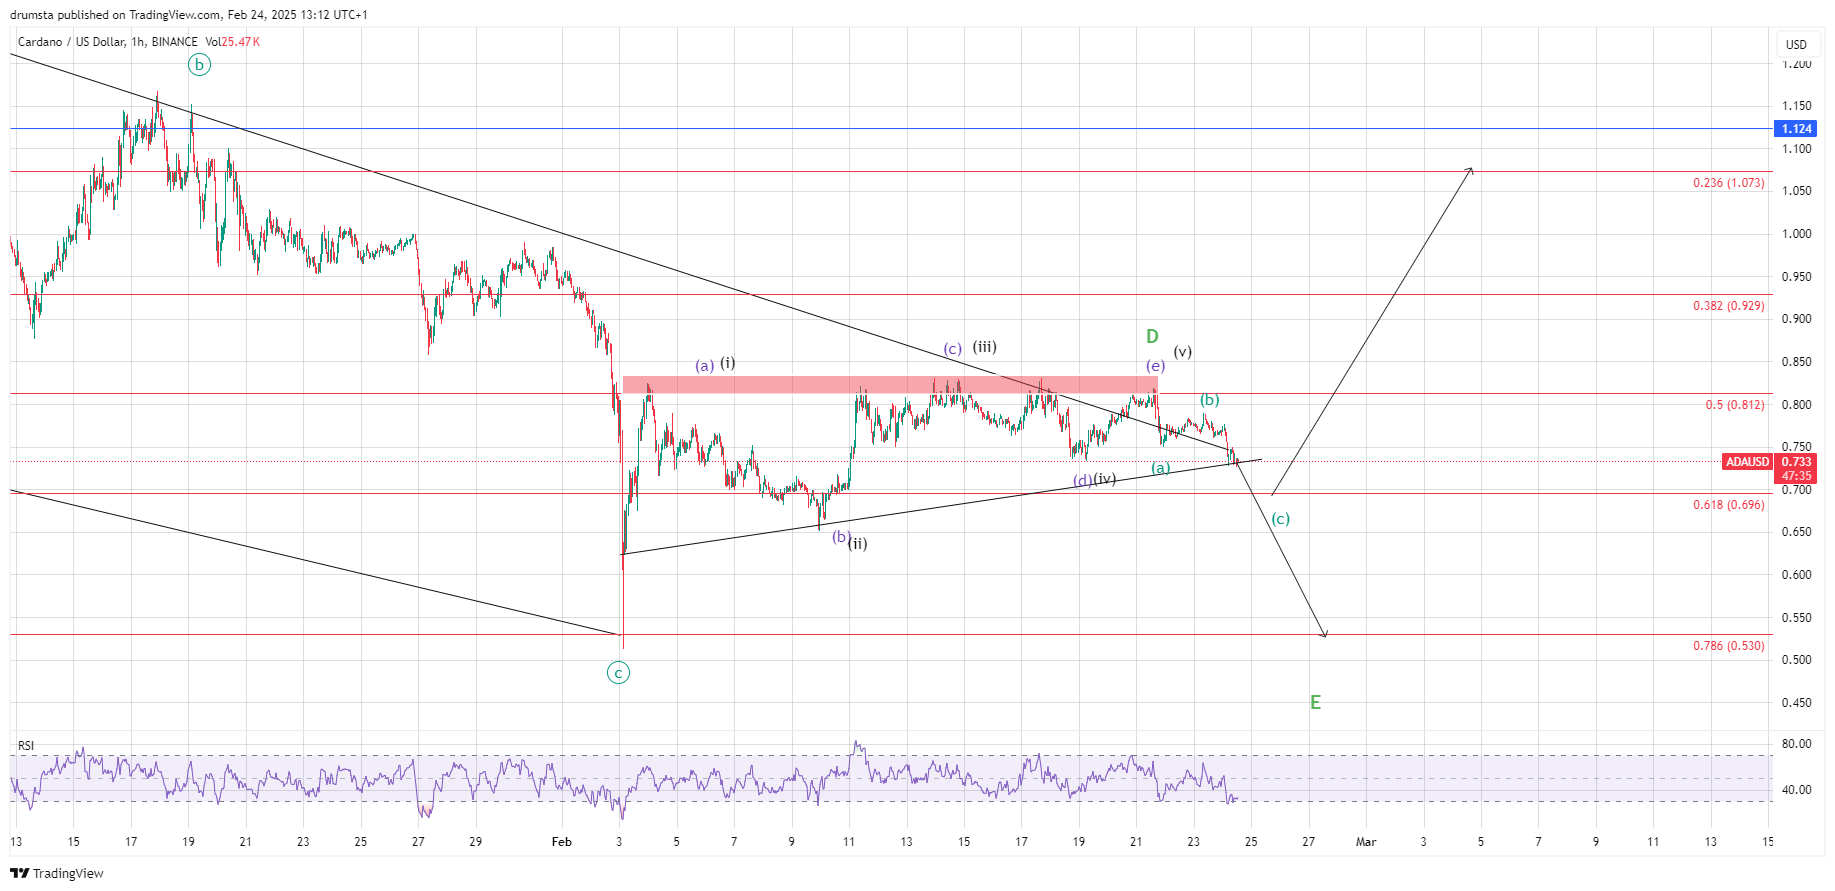
On the 1-hour timeframe, ADA is currently testing the lower boundary of the descending wedge. Elliott Wave projections indicate the price is nearing the completion of Wave E, which would mark the final corrective move before a significant breakout.
Two potential scenarios emerge from this analysis:
Bullish Breakout: If ADA sustains support above $0.696 (0.618 Fibonacci), it could initiate an impulsive rally. A breakout above the wedge’s upper boundary would confirm the reversal, initially targeting $0.812 (0.5 Fibonacci), followed by $0.929 (0.382 Fibonacci). Further extensions could see ADA reaching $1.073 (0.236 Fibonacci) and potentially retesting the $1.124 resistance zone.
Bearish Continuation: A failure to hold above the 0.618 Fibonacci level would lead to another downward leg, likely completing Wave E at $0.530 (0.786 Fibonacci). This scenario aligns with an extended corrective structure before ADA finds a solid accumulation base for a reversal.
The RSI on the 1-hour chart is nearing oversold territory, which could indicate a possible bounce in the short term. However, price action must confirm strength through higher highs and increased volume before a breakout scenario is validated.
The differentiating factor between these scenarios is how the ascending structure since the Feb. 3 low of $0.50 is counted. Since we saw a five-wave advancement it could mean that we saw a leading diagonal which is a bullish structure.
On the other hand, considering the price context this could also be an ABCDE correction of a lower degree as the D wave the higher, In this bearish count we have one more low before the correction since the December high ends.
Key Levels to Watch
- Immediate Resistance: $0.812 (0.5 Fibonacci)
- Key Resistance: $0.929 (0.382 Fibonacci)
- Major Resistance: $1.073 (0.236 Fibonacci)
- Immediate Support: $0.696 (0.618 Fibonacci)
- Critical Support: $0.530 (0.786 Fibonacci)
- Breakout Target: Above $1.124 if momentum sustains
- Invalidation Zone: Below $0.530, signaling deeper correction
About the Author
Bob MasonChief Crypto Boss
TEST 30 He has written extensively for a broader audience and his current focus is on developments relating to the financial markets including, but not limited to currencies, commodities, alternative asset classes, and global equities.
Latest news and analysis


Advertisement