
Advertisement
Advertisement
Ripple (XRP) Holds Critical Support as ETP Inflows Defy Market Trend
By:
Key Points:
- Symmetrical triangle nearing resolution, breakout imminent
- Elliott Wave count suggests corrective phase completion
- RSI divergence signals potential price reversal

XRP’s price action has been consolidating within a well-defined symmetrical triangle, reflecting indecision in the market. With recent outflows in crypto ETPs, XRP stands out as one of the few assets attracting investor interest, indicating confidence in its long-term outlook.
The provided charts illustrate an Elliott Wave structure, suggesting that XRP is at a critical juncture where a breakout could determine its next major move. Fibonacci retracement levels and RSI readings offer key insights into potential price trajectories.
XRP ETPs Sees Inflows
The cryptocurrency exchange-traded products (ETPs) market recorded its second consecutive week of outflows, with a total of $508 million exiting the space, according to CoinShares. Bitcoin ETPs saw the most significant redemptions at $417 million, while Ethereum also faced investor pullback.
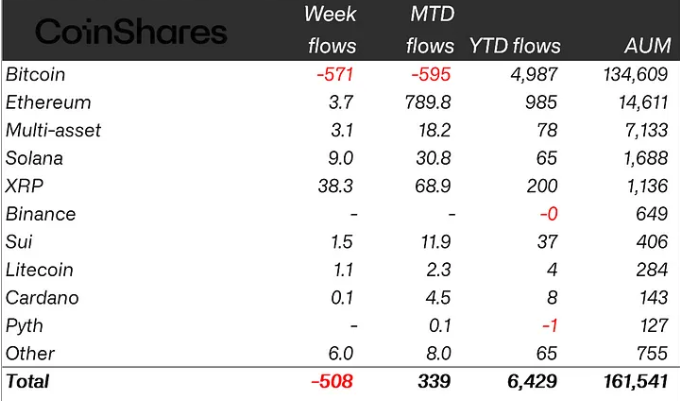
However, XRP stood out as one of the few assets to witness inflows, reflecting growing confidence in its long-term potential despite broader market hesitation. This divergence comes amid ongoing regulatory discussions surrounding XRP and Ripple, with some investors betting on a favorable outcome.
The resilience of XRP ETPs highlights selective optimism in the market, even as institutional investors reduce exposure to crypto assets more broadly. While the overall sentiment remains cautious, XRP’s ability to attract capital suggests that certain investors see it as a stronghold in an otherwise uncertain market environment.
XRP Price Analysis
XRP’s 4-hour chart reveals a complex Elliott Wave structure, indicating a prolonged corrective phase following its prior impulsive wave. The price has been forming a symmetrical triangle, with the current price action testing the lower boundary of this structure. The formation of a W-X-Y corrective pattern suggests that the market has been consolidating since the last major impulsive move.
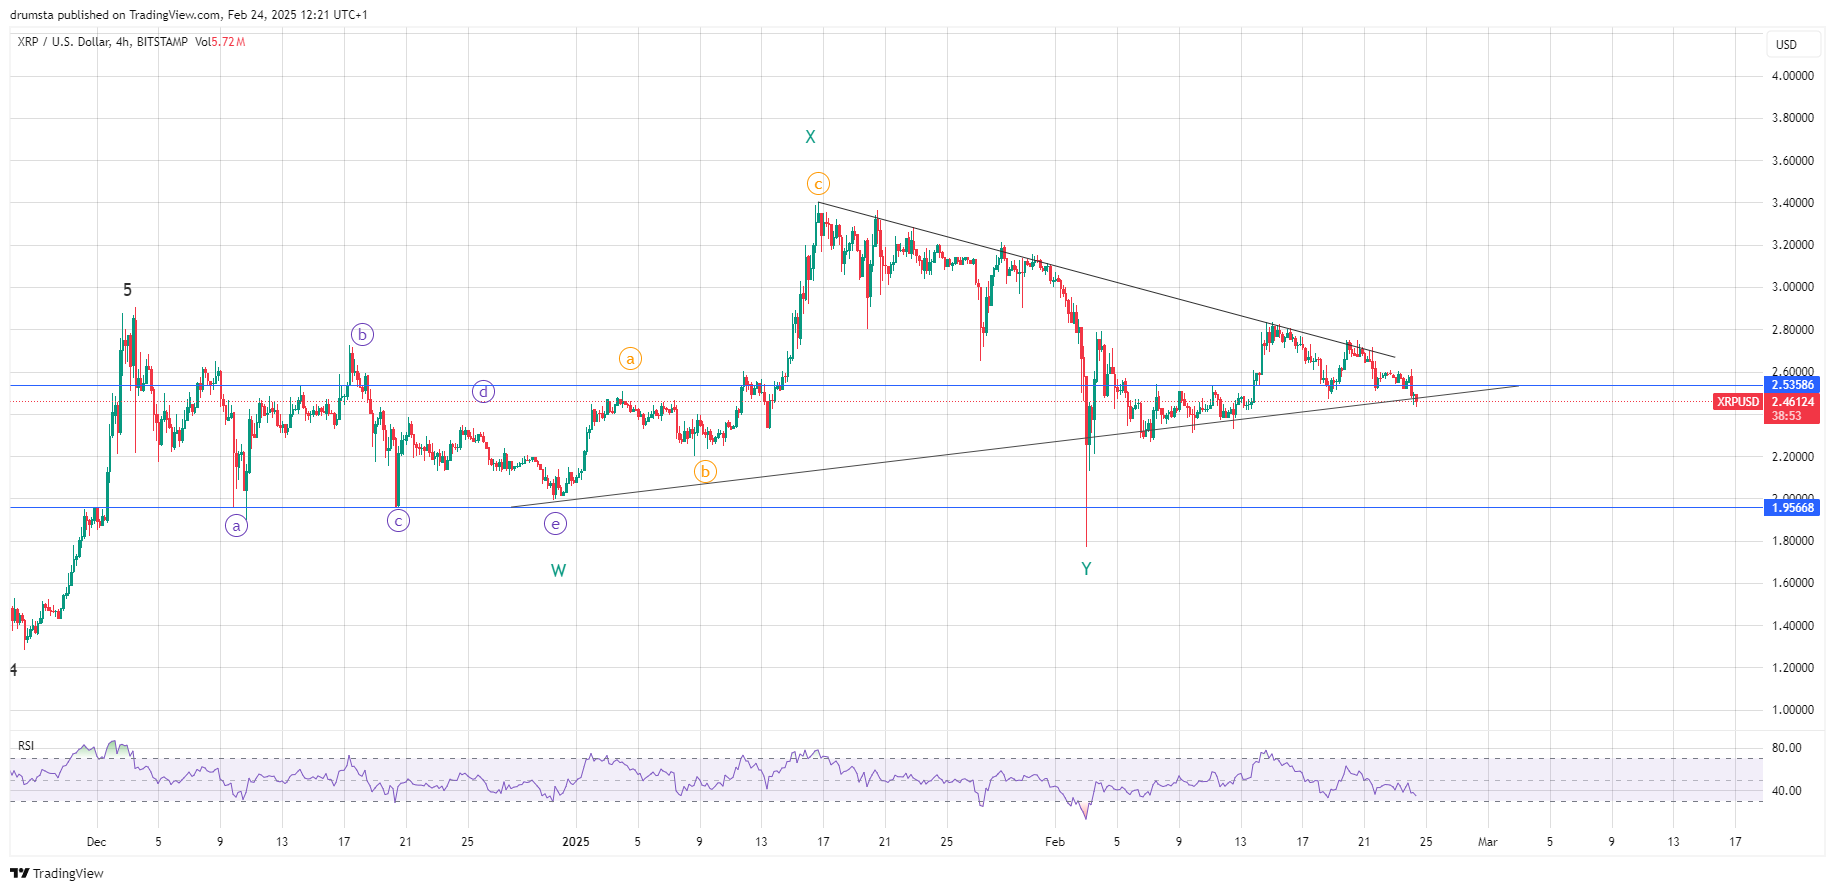
The 4-hour Relative Strength Index (RSI) has been oscillating near neutral territory, indicating market indecision. However, a recent dip toward oversold levels may suggest that selling pressure is exhausting. A break below the symmetrical triangle could lead to further downside towards $1.95, aligning with the next major support. Conversely, if XRP manages to hold this zone and break above the upper trendline, it could trigger a new impulsive wave, targeting key Fibonacci retracement levels.
Volume remains a crucial factor in confirming the next move. If a spike in buying volume accompanies a breakout, it would validate a bullish scenario. However, weak follow-through could result in a failed breakout and further price compression. The triangle’s resolution will be decisive in XRP’s medium-term trajectory.
XRP Price Prediction
The 1-hour chart provides a more detailed view of XRP’s recent movements, aligning with an Elliott Wave count that suggests an imminent move. The structure highlights a potential wave (ii) retracement, with price testing critical Fibonacci levels.
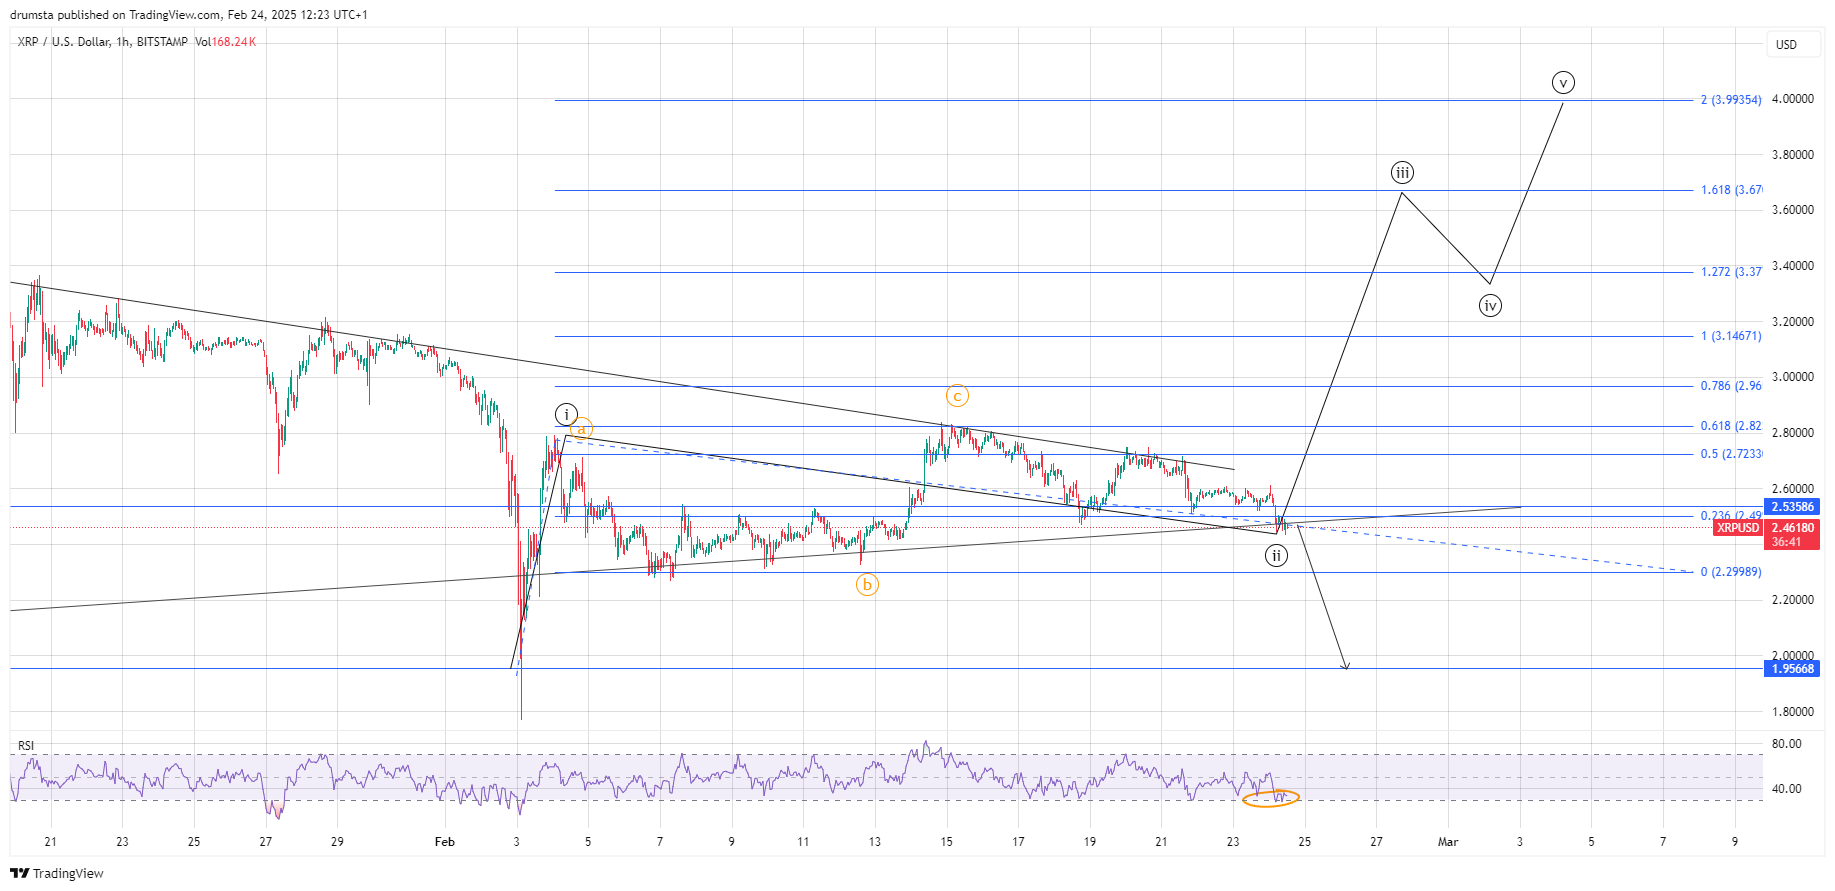
Currently, the price is interacting with the 0.236 Fibonacci retracement at $2.53, acting as a pivotal zone. If this level holds, wave (iii) could initiate, targeting $3.15 (1.0 Fibonacci extension) and potentially extending towards $3.67 (1.618 Fibonacci extension). However, if XRP fails to sustain above $2.53, it may see further downside towards $2.29 and even $1.95, where stronger support exists.
The RSI on the 1-hour chart shows a bullish divergence, suggesting that bearish momentum is weakening. This supports the possibility of an upward move in the coming sessions. If the price confirms a breakout above $2.72, the bullish scenario gains more credibility, with wave (iii) extending higher. However, a breakdown below $2.29 would invalidate this outlook and shift momentum toward further corrective movement.
Key Levels to Watch
- Immediate Resistance: $2.72 (0.5 Fibonacci retracement)
- Key Resistance: $3.15 (1.0 Fibonacci extension)
- Major Resistance: $3.67 (1.618 Fibonacci extension)
- Immediate Support: $2.53 (0.236 Fibonacci retracement)
- Key Support: $2.29 (trendline support)
- Critical Support: $1.95 (macro support level)
About the Author
Bob MasonChief Crypto Boss
TEST 30 He has written extensively for a broader audience and his current focus is on developments relating to the financial markets including, but not limited to currencies, commodities, alternative asset classes, and global equities.
Latest news and analysis


Advertisement