
Advertisement
Advertisement
Crude Oil Price Forecast: Crude Holds 20-Day MA Amid Bearish Pressure
By:
Crude oil remains range-bound, with support and resistance at key moving averages, as traders await confirmation of a breakout or deeper pullback.
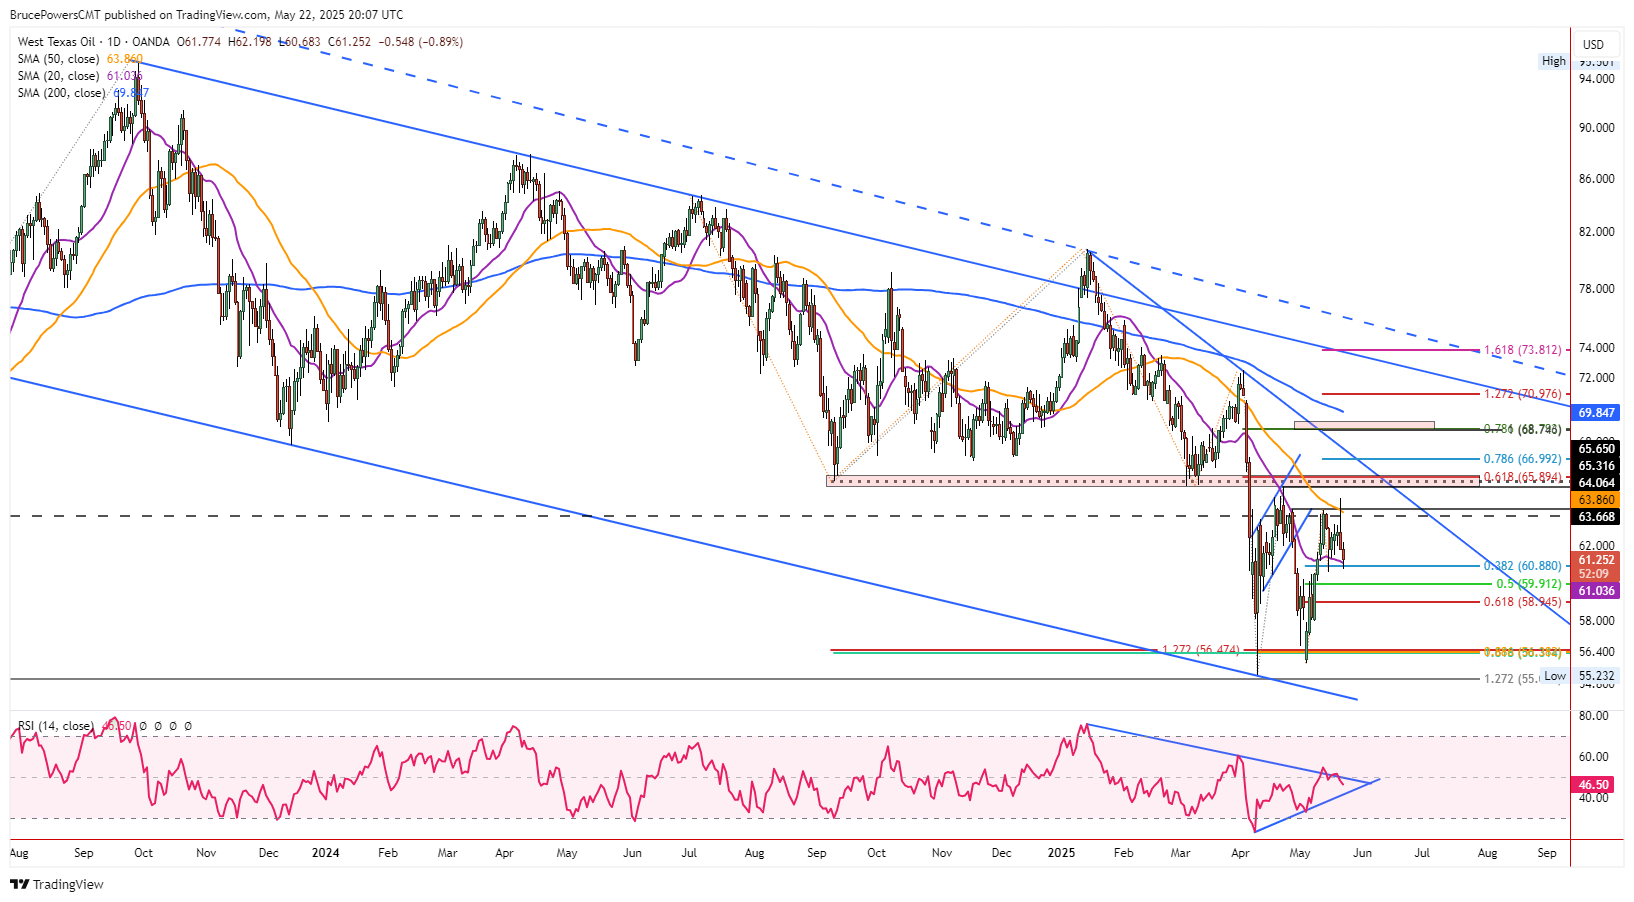
Crude oil has been consolidating in a relatively tight price range for the past nine days or so. Support has been represented by the 20-Day MA, now at $61.06, and resistance around the 50-Day MA, currently $63.87. The actual high and low of the range is $66.67 and $60.55. An upside breakout attempt was made on Wednesday, resulting in the current high of the range. However, the day ended with a bearish candle and a close near the low of the day.
A bearish continuation triggered today before support was seen at the day’s low of $60.68. That was a successful test of support at the 20-Day MA as it was followed by an intraday bounce. At the time of this writing crude oil is trading in the top half of the day’s price range, reflecting short-term strength.
Failed Weekly Breakout
The initial rally on Wednesday hit resistance around the 50-Day MA, before sellers took charge. It also triggered a breakout above the three-week high of $65.06. An advance above that high, followed by it being confirmed with a daily close above it, will set the stage for higher prices. In other words, downward pressure remains unless crude can close above the three-week high. Since the 50-Day MA is currently lower than that, it would have also been reclaimed by then, providing further bullish evidence.
Rejection of Price at 50-Day Line
Nonetheless, the clear downside rejection from the 50-Day MA could lead to a deeper pullback before another breakout attempt is made. Notice the reaction during the previous rally that tested the 50-Day MA in early-April. Buyers were able to push the price above the line for a couple days before a bearish reversal took hold. During the current approach, sellers took charge relatively earlier than the prior test of the 50-Day line. This is a bearish sign that has been dampened so far by the 20-Day MA support.
Deeper Pullback Targets $59.91
Therefore, a deeper pullback towards the 50% retracement at $59.91 or the 61.8% Fibonacci retracement level at $58.95 may occur before crude oil is ready for a more serious bullish breakout attempt. This is not surprising and consistent with the development of a bottom.
For a look at all of today’s economic events, check out our economic calendar.
About the Author
Bruce Powerscontributor
Bruce has been involved in the financial markets for over 20 years, as an analyst, trader, educator, and writer.


Advertisement