
Advertisement
Advertisement
Crude Oil Price Forecast: Potential Bullish Reversal Emerges After Sharp Decline
By:
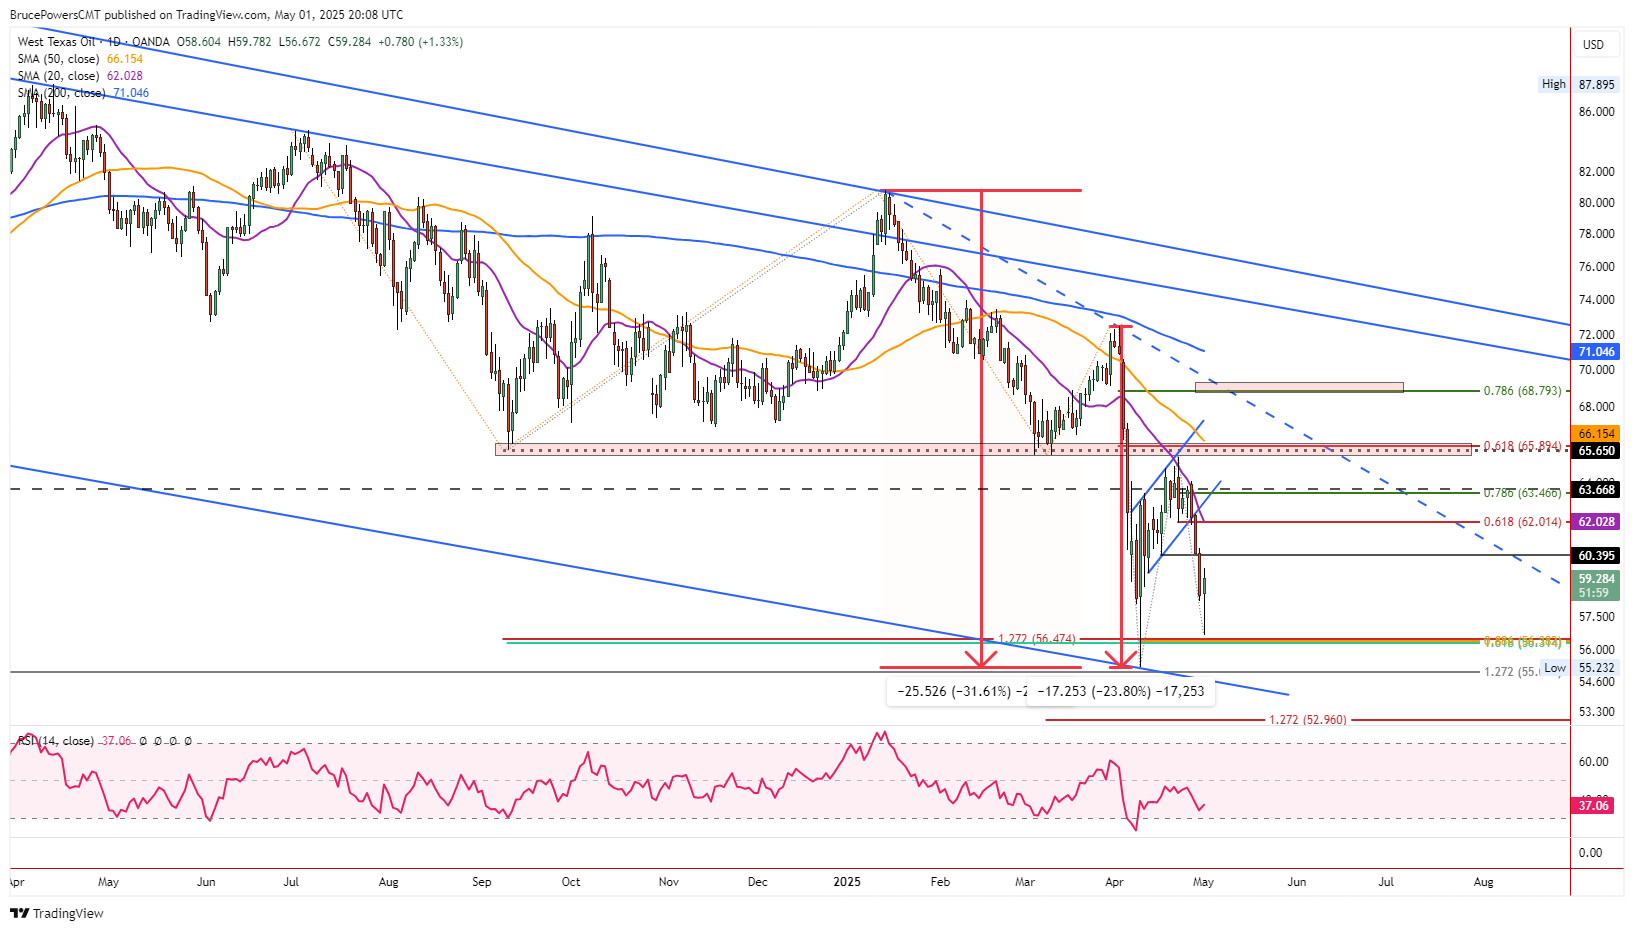
Crude oil rebounded from a $56.67 low, showing potential early signs of strength that could lead to a bullish reversal within a broader downtrend.
Crude oil fell to a new retracement low of $56.67 on Thursday as it tested the prior support zone that ended at $55.23 on April 9. Following the day’s low, which just about reached an 88.6% retracement of the counter trend rally, buyers took back control. The day establishes a second bottom for a potential double bottom pattern. Nonetheless, that won’t be established for a while, but there is a chance that today’s low will create a higher swing low.
If established, that would be a short-term bullish sign that could be more significant if it leads to a bottom. At the time of this writing, trading is occurring in the top half of the day’s price range, above $58.00, and above Wednesday’s low of $58.21. If crude oil can end Thursday’s session above those two price levels, it will be showing early signs of strength that could lead to a bullish reversal.
Bullish Hammer Pattern
There is a possible one-day bullish hammer reversal candle to be established today. If so, a breakout above today’s high confirms the pattern. It shows sellers being in control earlier in the day’s trading session as crude oil dropped below yesterday’s low and signaled a bearish continuation. But sellers could not maintain control and the price of crude subsequently advanced following a $56.67 low.
Thursday’s trading range was relatively wide, from $56.67 to $59.33, and it occurred within a sharp three-day decline contained within a larger bearish trend. Therefore, it wouldn’t be surprising to see a day of rest and consolidation inside today’s range before crude oil is ready to advance and trigger the potential hammer pattern.
Bull Breakout Above $59.33
Irrespective of bearish considerations, a bullish breakout will be indicated on a rally above today’s high of $59.33 and confirmed by a daily close above that high. Crude oil would then rise in a larger downtrend and up into resistance zones. The first price area to watch for minor resistance is around $60.40, which was an interim higher swing low. Since resistance was found during the first counter-trend rally around the 20-Day MA, currently at $62.00, it provides a maximum initial upside target if today’s signs of strength lead to a bounce. However, the 61.8% Fibonacci retracement level at $62.01 currently marks the same price area. It provides another target, and it is correlated with prior daily support.
For a look at all of today’s economic events, check out our economic calendar.
About the Author
Bruce Powerscontributor
Bruce has been involved in the financial markets for over 20 years, as an analyst, trader, educator, and writer.


Advertisement