
Advertisement
Advertisement
Crude Oil Price Forecast: Struggles Below Key Levels, Downtrend Risks Persist
By:
Crude oil struggles near key technical levels after a breakdown in a symmetrical triangle pattern, leaving uncertainty as prices hover near important support zones.
In this article:
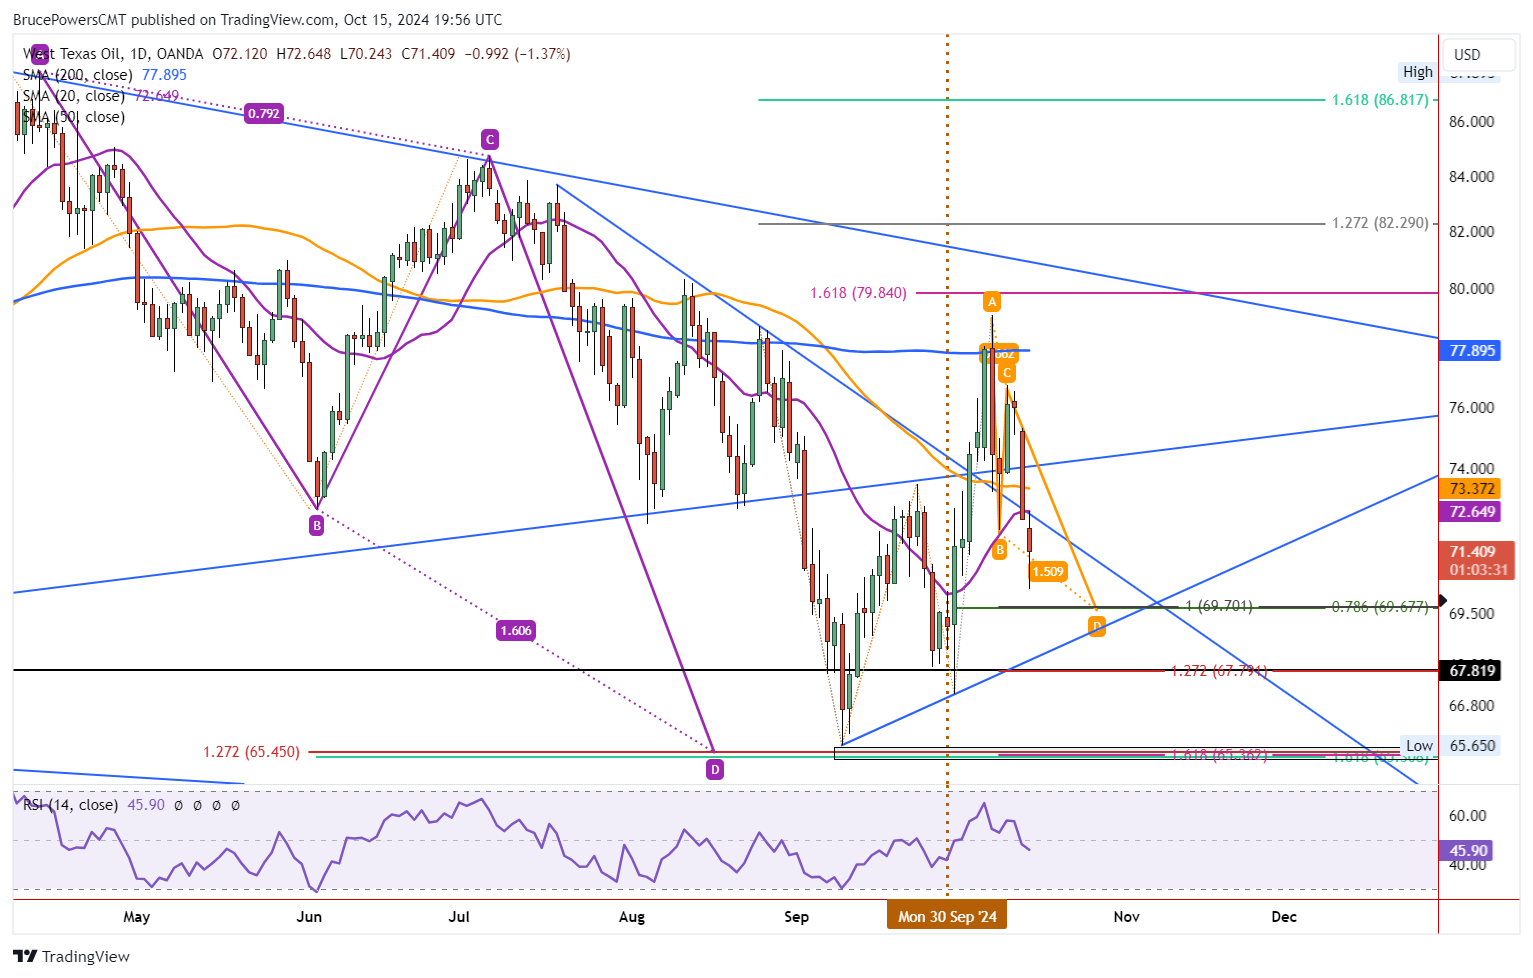
Crude oil continues to fight for direction as it grapples with a large symmetrical triangle consolidation pattern. It fell again on Tuesday to a new pullback low of 70.24 before finding support and bouncing. However, some technical damage was done as of yesterday when the internal downtrend line and both the 50-Day MA and 20-Day MAs were broken to the downside. Today’s bearish price action further confirms the breakdown. Moreover, crude oil is back below the lower boundary line of the triangle pattern.
Bearish Sentiment Dominates
The rally from the previous two weeks highlighted a possible failure of the triangle breakdown that triggered at the start of September. However, the rally failed to exceed the 200-Day MA, now at 79.56, as well as the top pattern trendline. The high day ended as a key reversal day and led to the current retracement.
Next Lower Target at 69.70
A descending ABCD pattern completes at 69.70, along with the 78.6% retracement. It provides the next lower potential support zone. Although today’s low may complete the ABCD pattern, given the breakdown below key levels noted above, it wouldn’t be surprising to see the current retracement generating further uncertainty before it is complete.
Facing Critical Pivot Zone
Given the triangle pattern, crude oil is in a critical pivot zone. Once the trend is determined, either a bearish continuation of the breakdown or a subsequent bull rally through the top of the triangle pattern, the potential for crude to start trending improves. Key near-term price levels to watch for signs are the recent interim swing high of 76.72 and the swing low at 67.11. The lower uptrend line rising from the September low can also provide clues. It marks potential support and if broken to the downside triggers a bearish signal.
Rally Above 20-Day MA Needed for Strength
Also, for additional signs of strength, reclaiming the 20-Day MA and then the 50-Day MA would be supportive of a bullish scenario. Crude remains in a downtrend as defined by falling moving averages. It also remains below the long-term 200-Day MA following a successful test of resistance. Once resistance was tested following the late-July breakdown below the 200-Day line, the door opens for a bearish continuation. At least that possibility is the challenge.
For a look at all of today’s economic events, check out our economic calendar.
About the Author
Bruce Powerscontributor
Bruce has been involved in the financial markets for over 20 years, as an analyst, trader, educator, and writer.
Latest news and analysis


Advertisement