
Advertisement
Advertisement
Ethereum (ETH) Elliott Wave Analysis: Price at Key Support With Reversal Likely
By:
Key Points:
- Potential trend reversal near $2,125 support
- Breakout above $2,503 confirms bullish momentum
- Failure to hold $2,125 risks drop to $1,586

Ethereum’s (ETH) price action suggests the end of a multi-month correction, with a potential reversal forming near the $2,125 support level. While bullish divergence on RSI indicates recovery, ETH must break key resistance at $2,503 to confirm upside momentum.
ETH Price Analysis
Ethereum’s daily chart presents a multi-month corrective structure, culminating in a significant decline that shaped a well-defined descending channel. The corrective pattern appears to be an extended WXY structure, with wave Y bottoming out at $2,125, a level that coincides with the 0.618 Fibonacci retracement from its prior rally.
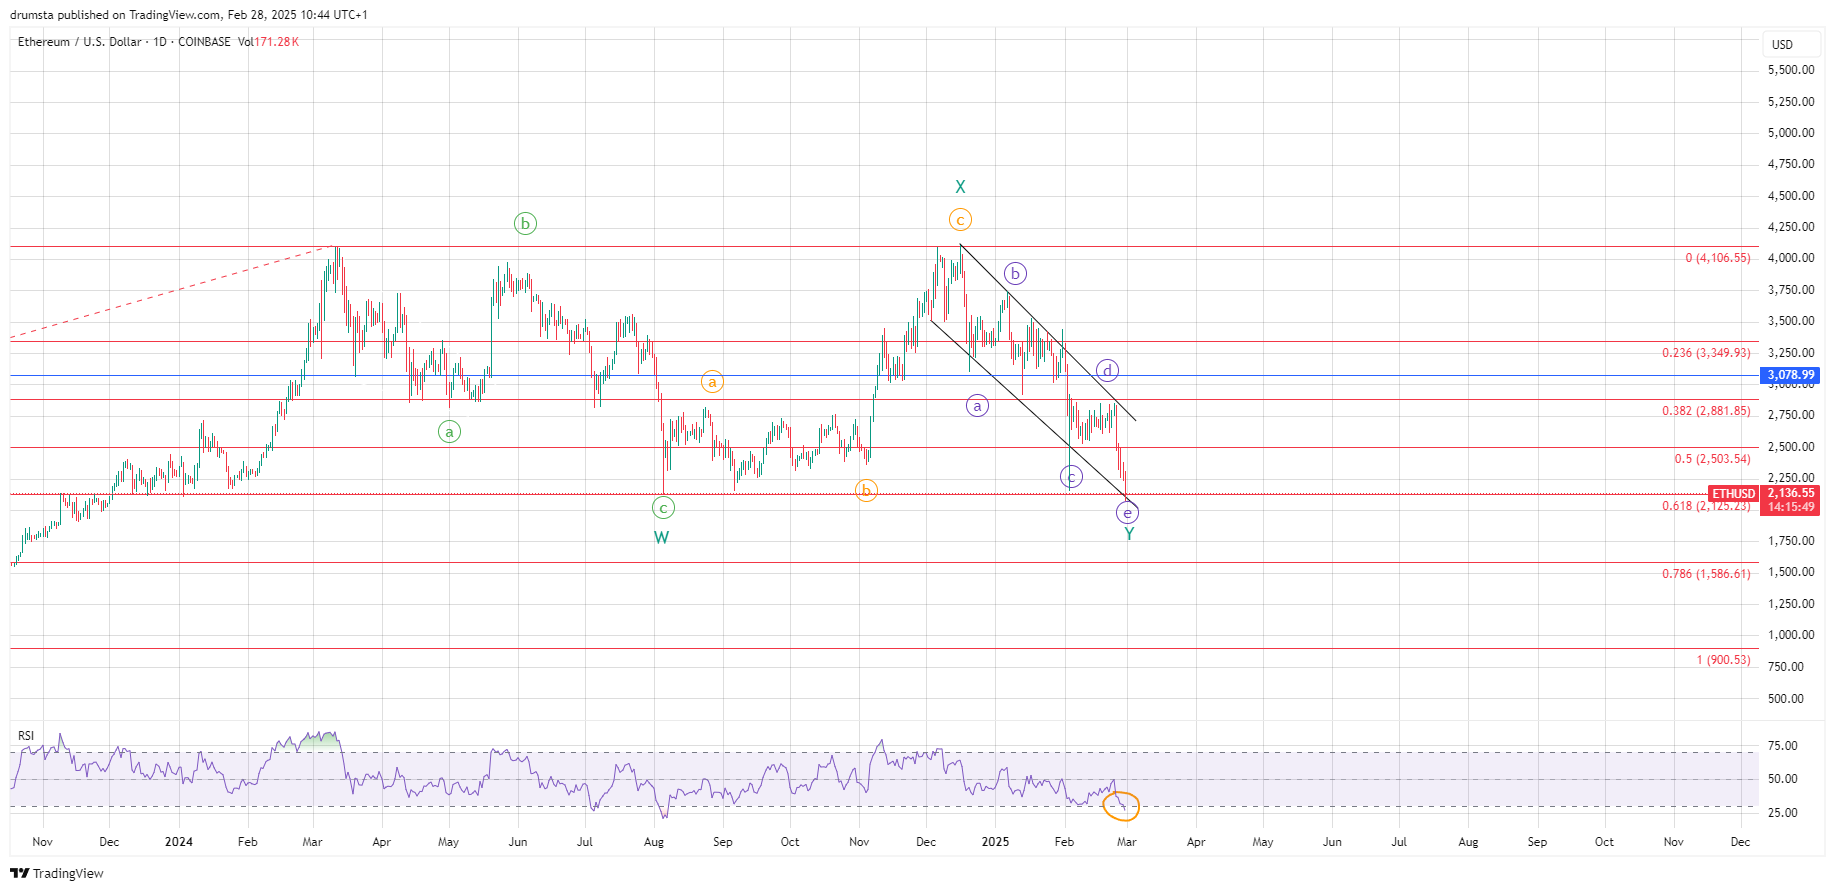
This alignment with a critical Fibonacci level suggests a potential exhaustion of the downtrend, especially as the daily Relative Strength Index (RSI) exhibits a pronounced bullish divergence, historically indicative of an impending trend reversal.
Despite this promising support level, Ethereum remains firmly confined within the descending channel, struggling to establish a definitive breakout. The primary resistance level to watch stands at $2,503, aligning with the 0.5 Fibonacci retracement of the preceding decline.
A breakout above this zone would serve as a strong validation for bullish momentum, potentially driving ETH towards $2,881 (0.382 Fibonacci) and eventually to $3,078, which marks a previous structural resistance level.
The RSI remains oversold but has begun showing early signs of recovery, suggesting that a relief rally could be in the making. However, bullish confirmation requires sustained price action above $2,503.
Conversely, failure to hold above $2,125 would put Ethereum at risk of deeper losses, potentially revisiting the $1,586 support, which coincides with the 0.786 Fibonacci retracement. This zone would act as a last line of defense against a prolonged bearish phase, and its loss could trigger further downside pressure.
ETH Price Prediction
On the hourly timeframe, Ethereum’s price action suggests the early development of a potential five-wave impulsive recovery. After falling towards the $2,125 level, price action is beginning to carve out an initial recovery wave (i), followed by a corrective wave (ii).
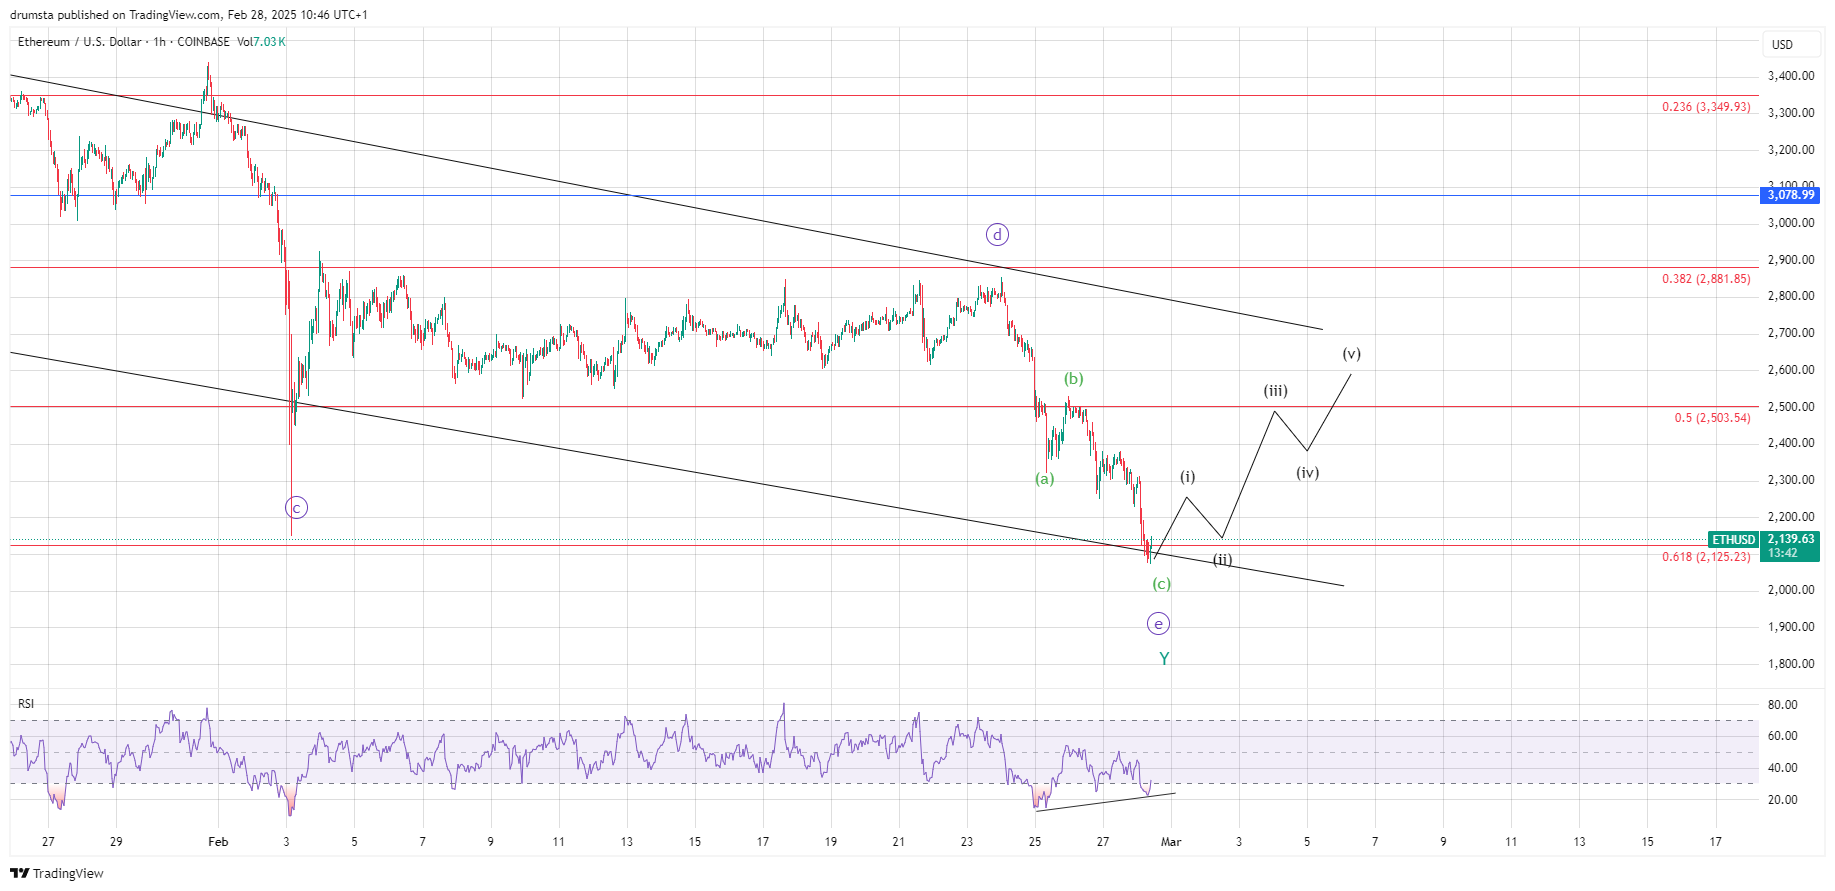
If this Elliott Wave count is correct, Ethereum could extend higher in wave (iii), with a key target aligning around $2,503, which represents the 0.5 Fibonacci retracement and a major resistance threshold.
The confirmation of this impulsive structure hinges on Ethereum’s ability to sustain higher lows and establish a clear upward trajectory. If bullish momentum persists and ETH successfully clears $2,503, the next logical upside targets lie at $2,881 and $3,078, which correspond to both the descending channel’s upper boundary and the 0.382 Fibonacci retracement level of the larger corrective decline. These targets would provide a crucial test for Ethereum’s ability to reclaim a bullish market structure.
Conversely, should Ethereum fail to maintain its short-term impulsive structure, a retest of $2,125 remains likely before another attempt at recovery. A breakdown below this critical support level would invalidate the current wave count, suggesting that the broader corrective trend is not yet complete. In such a scenario, Ethereum could seek lower support at $1,586, where the 0.786 Fibonacci retracement level resides.
Key Levels to Watch
- Immediate Resistance: $2,503 (0.5 Fibonacci retracement)
- Key Support: $2,125 (0.618 Fibonacci retracement)
- Critical Support: $1,586 (0.786 Fibonacci retracement)
- Short-Term Target for Wave (iii): Above $2,503 if momentum sustains
- Invalidation Zone: Below $2,125, signaling further downside risks
About the Author
Bob MasonChief Crypto Boss
TEST 30 He has written extensively for a broader audience and his current focus is on developments relating to the financial markets including, but not limited to currencies, commodities, alternative asset classes, and global equities.
Latest news and analysis


Advertisement