
Advertisement
Advertisement
Gold and Silver Technical Analysis: XAUUSD Breaks $3,400, XAGUSD Finds Support at $35.40
By:
Key Points:
- Gold (XAUUSD) breaks $3,400 and ready to surge.
- Silver (XAGUSD) finds strong support at $35.40 and looks to rally further.
- US Dollar Index (DXY) attempts to break below 98 and remains under bearish pressure.

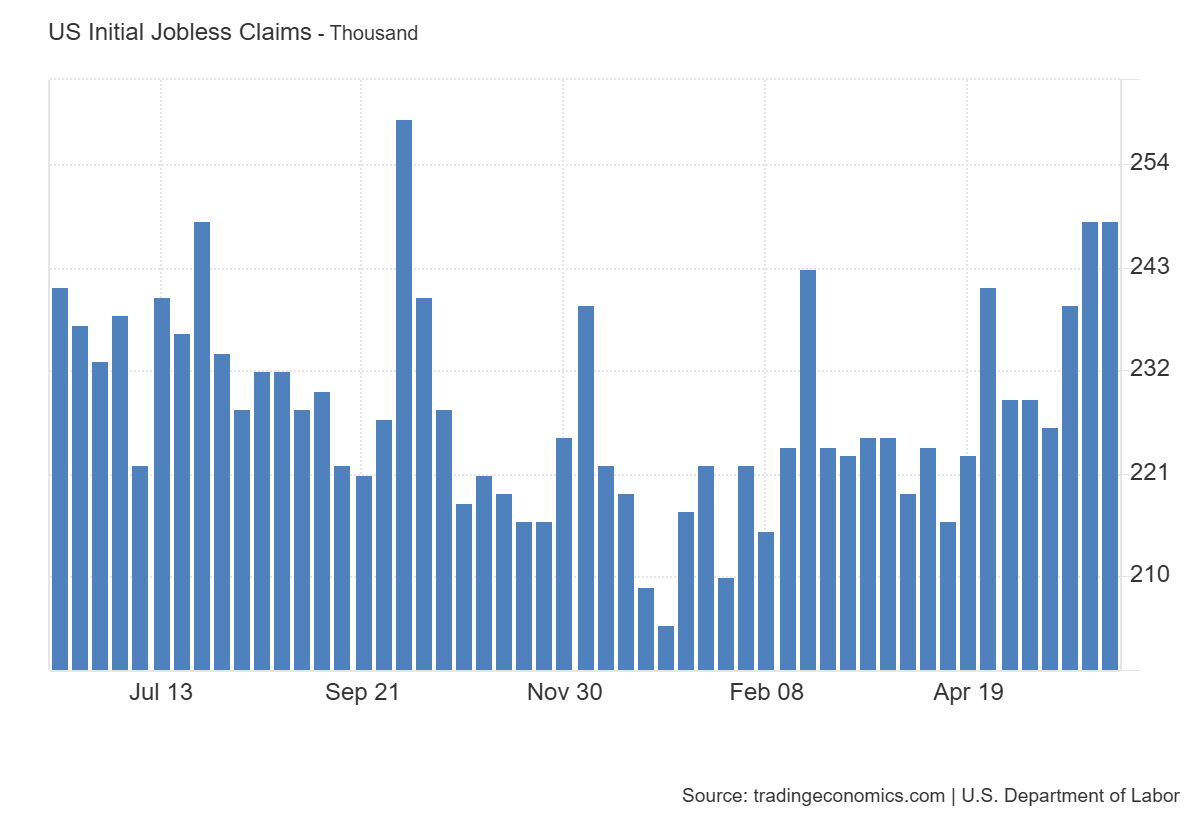
Gold (XAUUSD) extended its rally for the third consecutive day as expectations for a Fed rate cut increased. US inflation data came in softer, and jobless claims exceeded 240,000, suggesting weakening economic momentum. These signals have increased pressure on the Federal Reserve to act, boosting safe-haven demand and supporting gold’s momentum toward a break above $3,500.
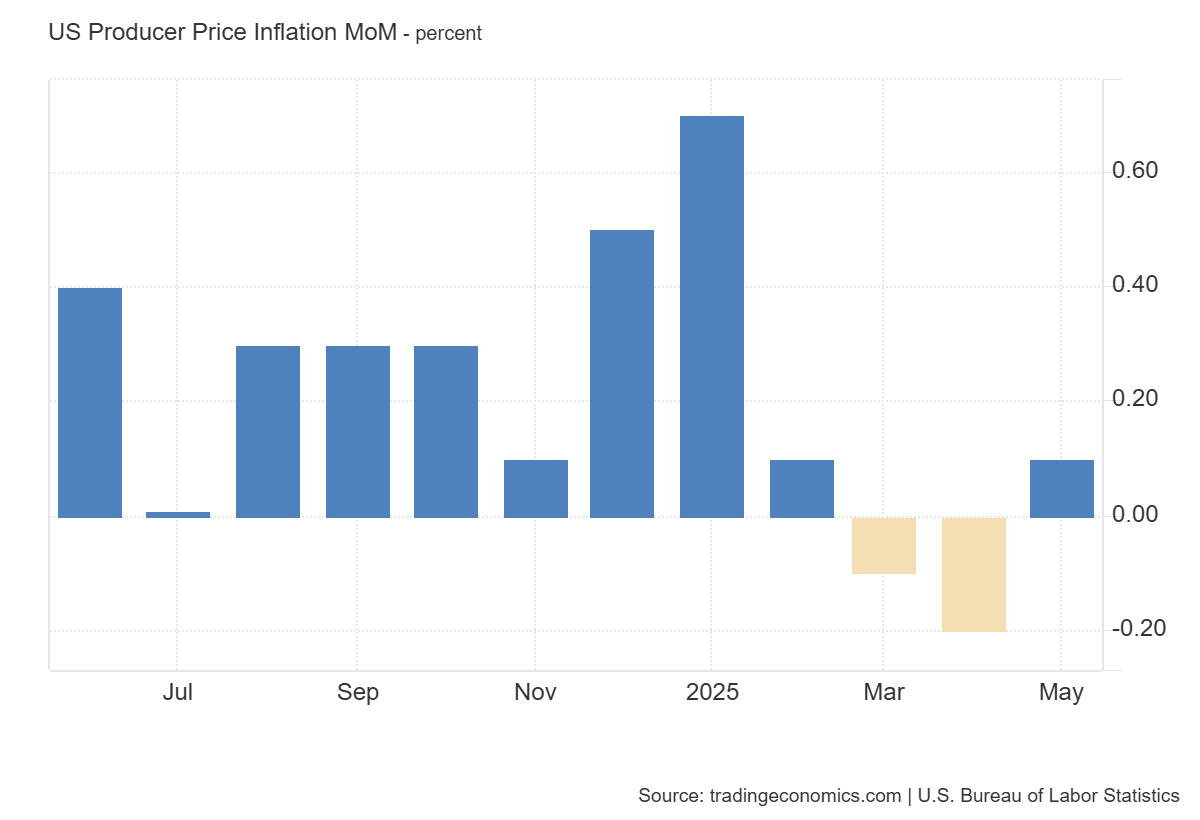
On the other hand, the US Dollar Index has dropped to 98, reaching a three-year low, while the 10-year Treasury yield has fallen to 4.367%. Real yields also declined to 2.097%, helping gold and silver (XAGUSD) gain momentum. Meanwhile, the chart below shows that May’s Producer Price Index (PPI) rose just 0.1%, below expectations. Slower inflation keeps the door open for monetary easing, reinforcing gold’s bullish outlook.
Moreover, the ongoing geopolitical crisis fuels gold’s momentum. Reports suggest that Israel may launch a military strike on Iran, while US officials prepare for high-level talks in Oman. These tensions, along with a fragile economic backdrop, are prompting investors to seek safe-haven assets. With money markets pricing in 51 basis points of Fed rate cuts by year-end, gold may continue to attract strong buying interest in the coming weeks.
Gold Technical Analysis
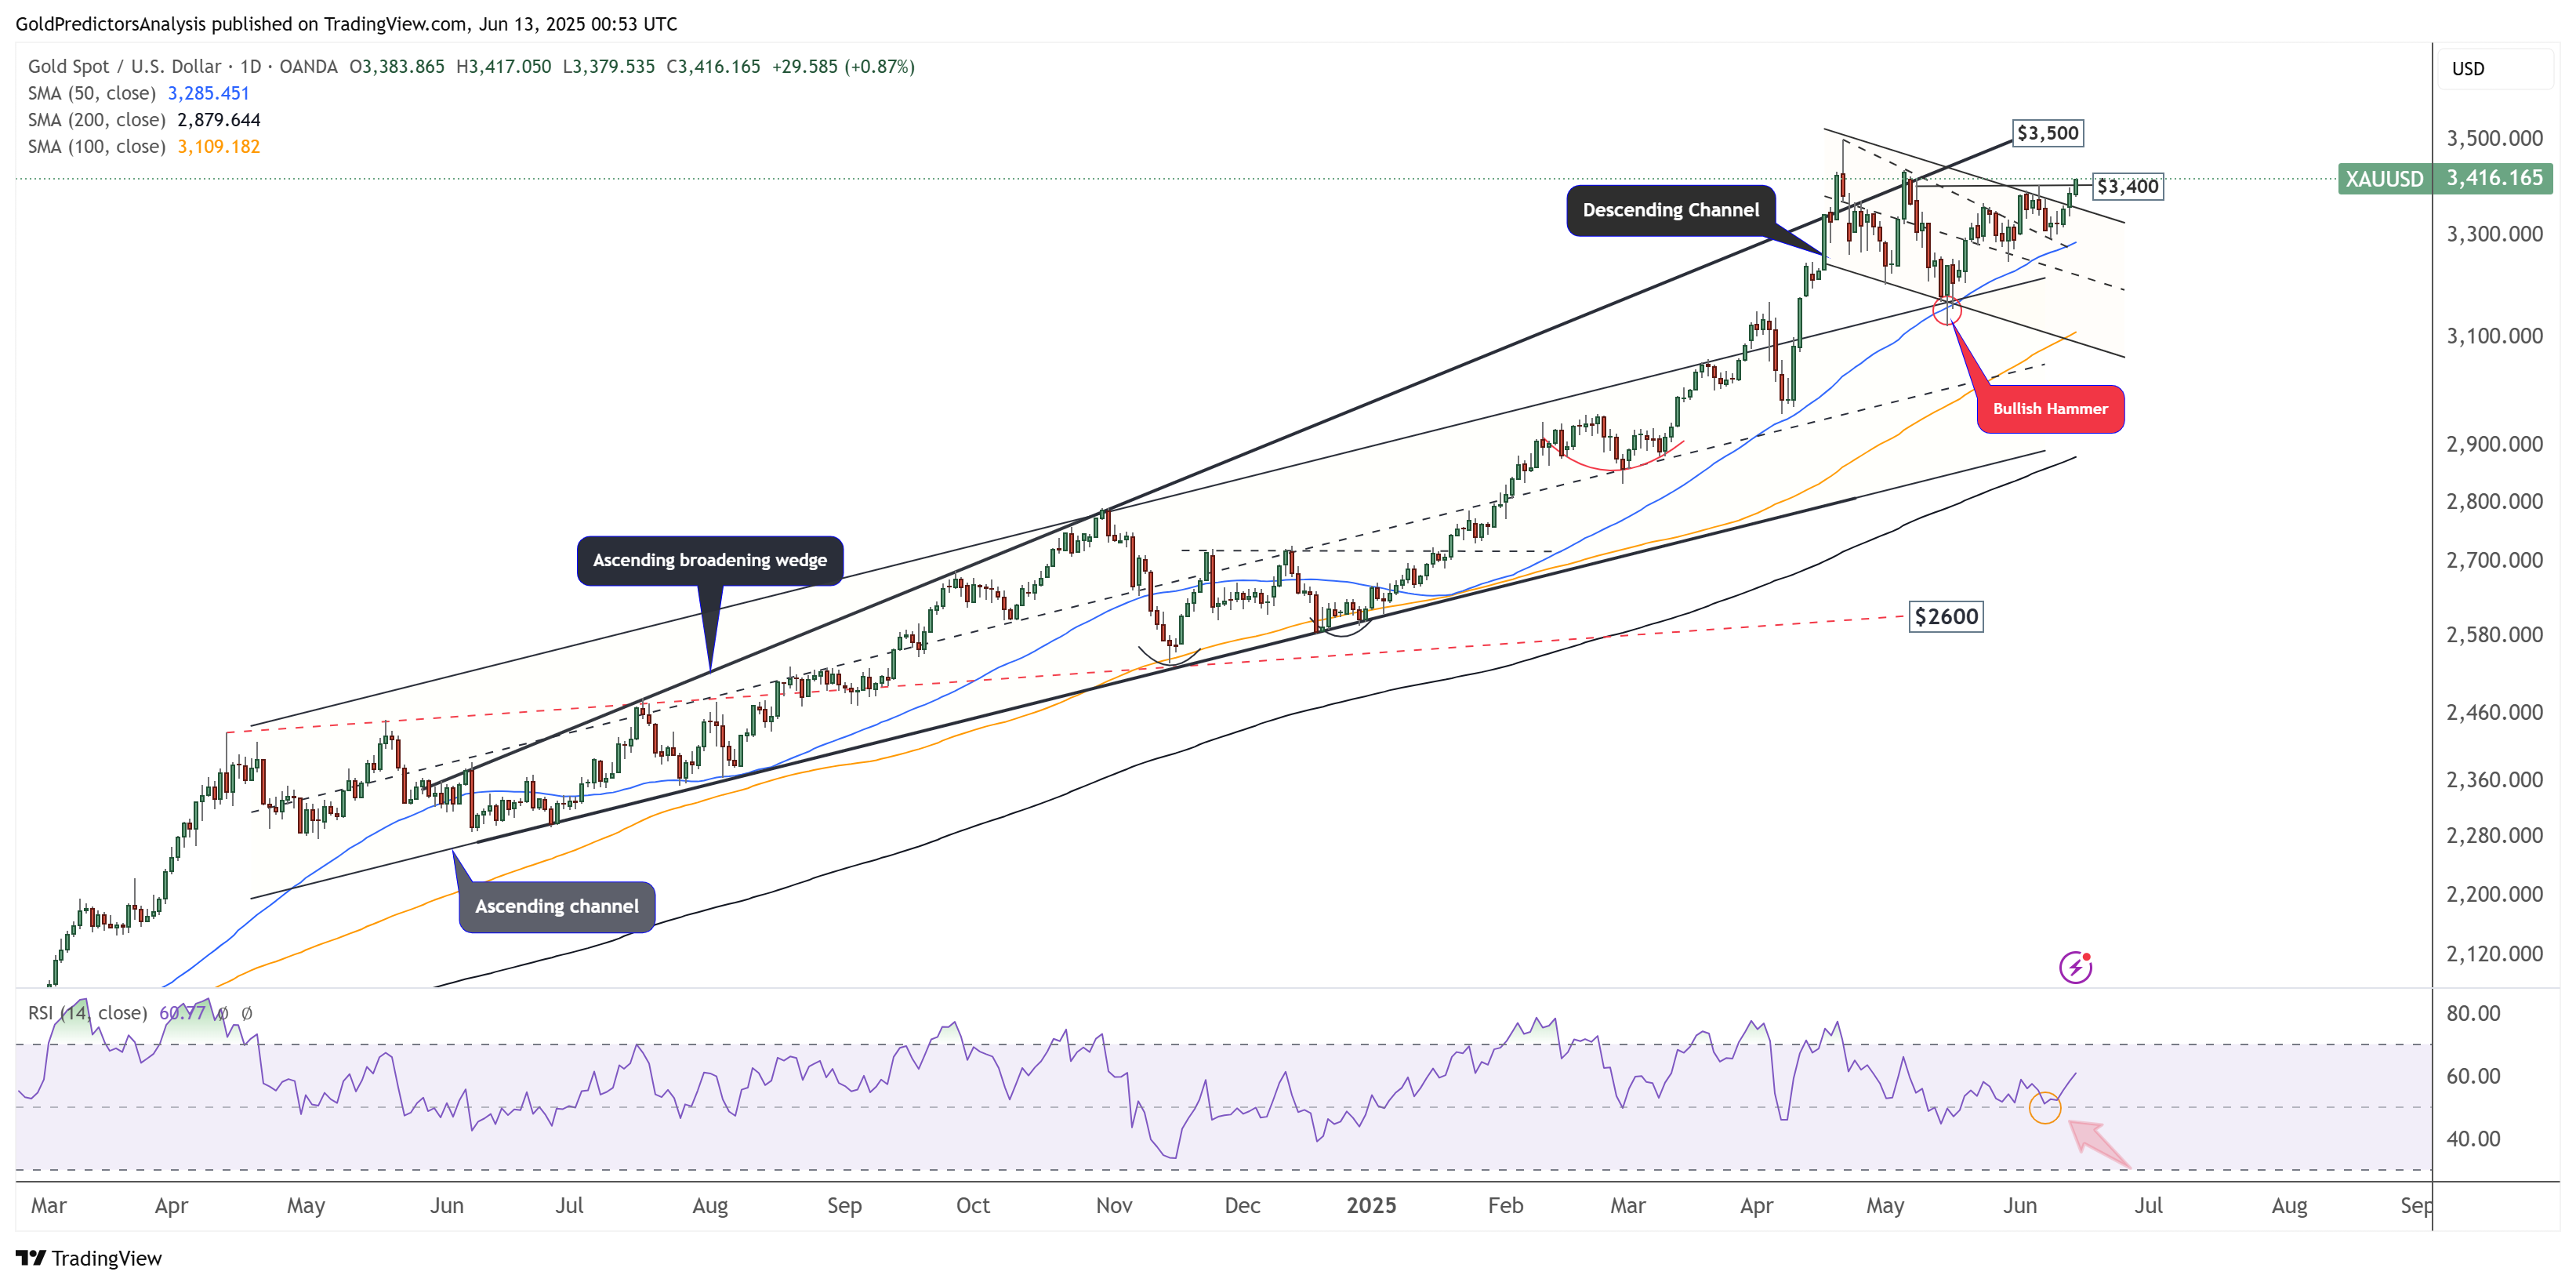
XAUUSD Daily Chart – Breakout from $3400
The daily chart for spot gold indicates that the price rebounds from the 50-day SMA and breaks the $3,400 area. The price remains above the 50-day and 200-day SMAs, indicating continued bullish momentum. Moreover, the RSI is rebounding from the mid-level, signaling a potential bottom. A break above $3,500 would likely trigger a move toward the $3,750 area.
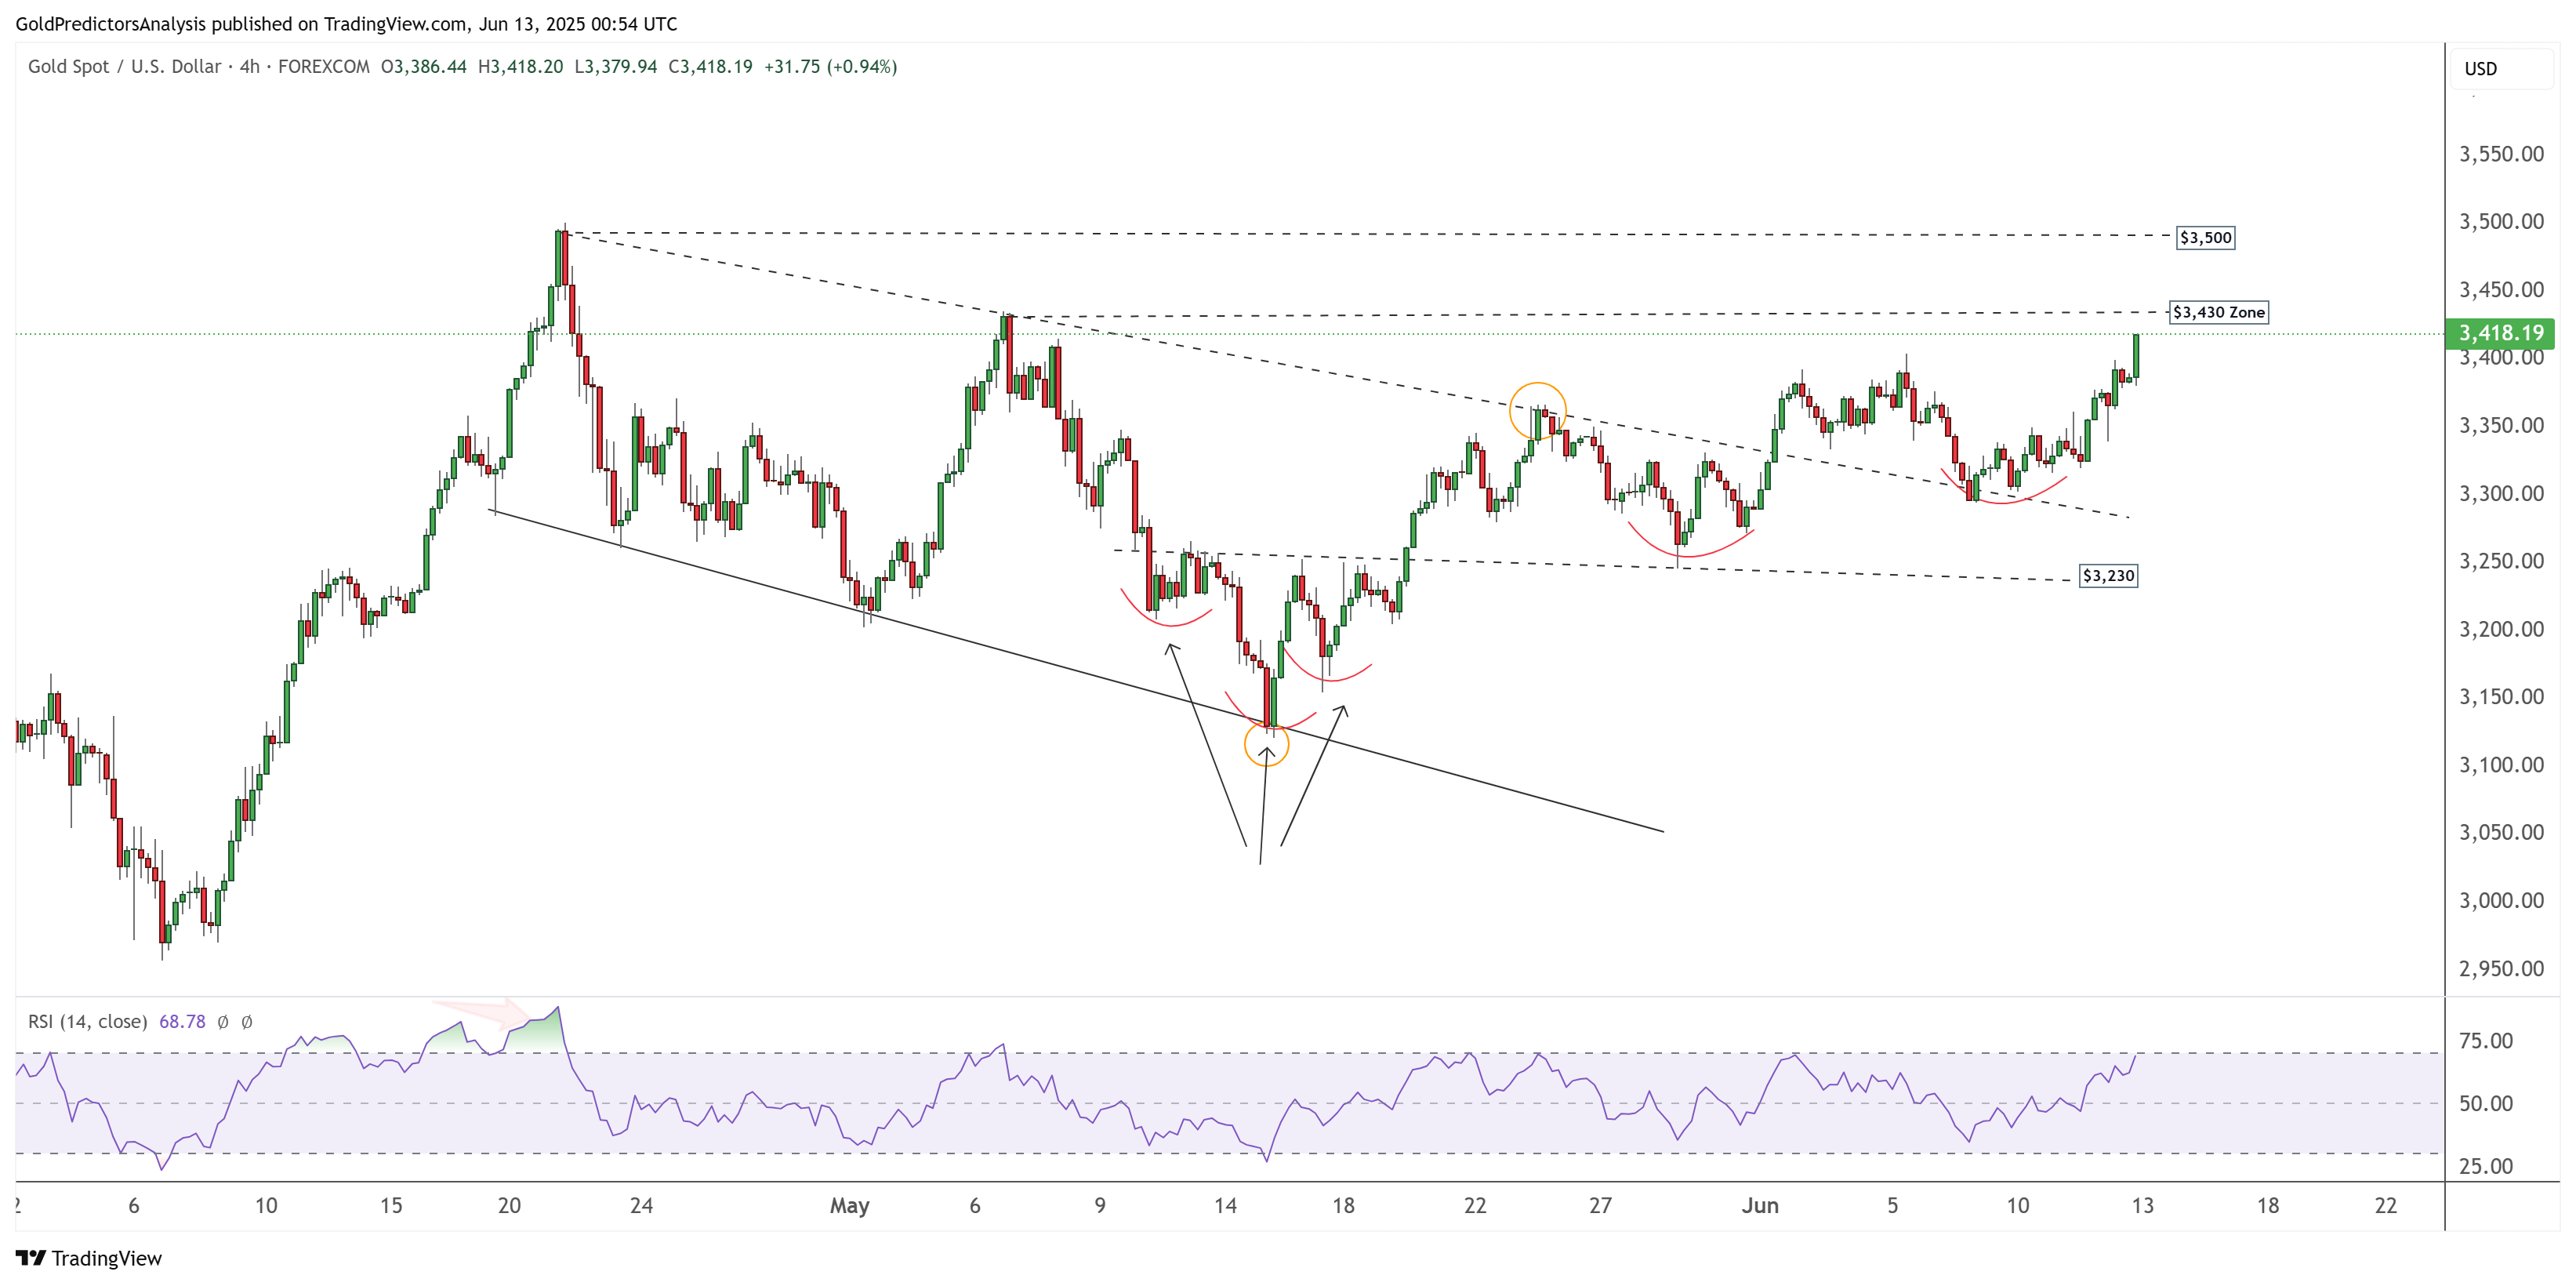
XAUUSD 4-Hour Chart – Bullish Momentum
The 4-hour chart for spot gold shows a constructive bullish price action, characterized by an inverted head and shoulders pattern with the neckline located at the $3,230 area. The price is currently challenging strong resistance in the $3,410–$3,430 zone. A break above $3,430 would likely initiate a move toward the $3,500 area. As long as the price remains above the $3,230–$3,300 range, the bullish momentum is likely to continue.
Silver Technical Analysis
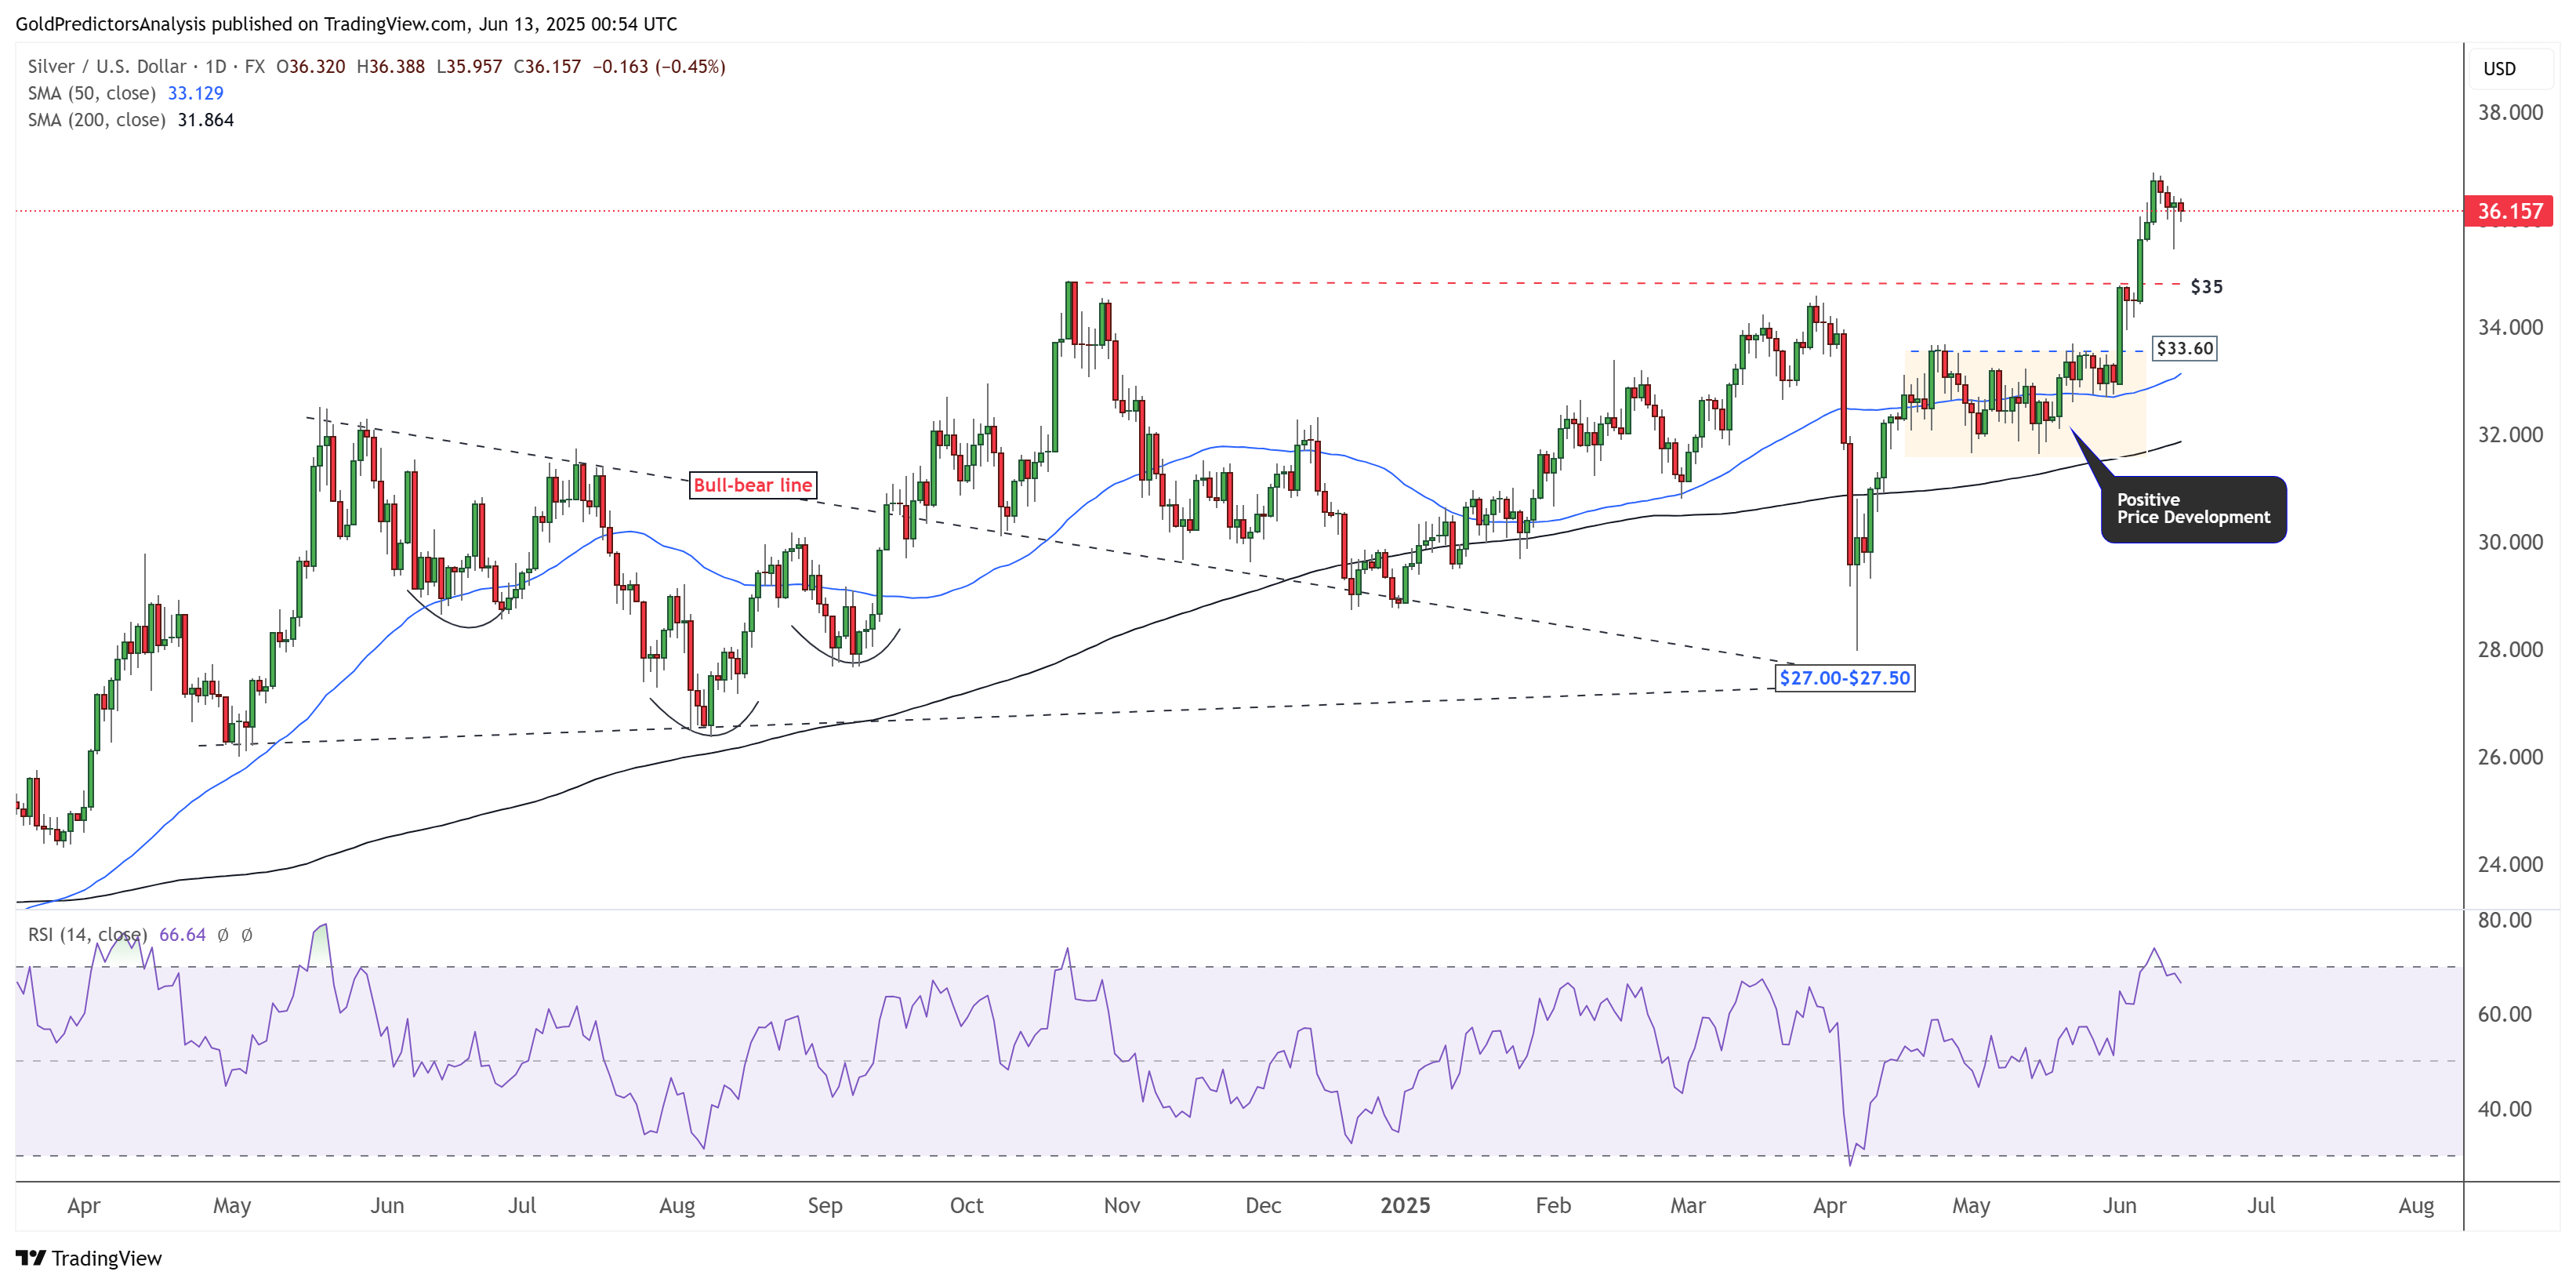
XAGUSD Daily Chart – Support at $35.40
The daily chart for spot silver shows that the price remains in a strong bullish momentum. The consolidation between the $30.15 and $33.60 levels has formed a positive price structure. Moreover, a breakout above $35 has initiated a strong surge. Despite this bullish trend, the RSI indicates overbought market conditions, suggesting a potential pause or pullback. However, silver has found strong support at $35.40, which could initiate another upward move in silver prices.
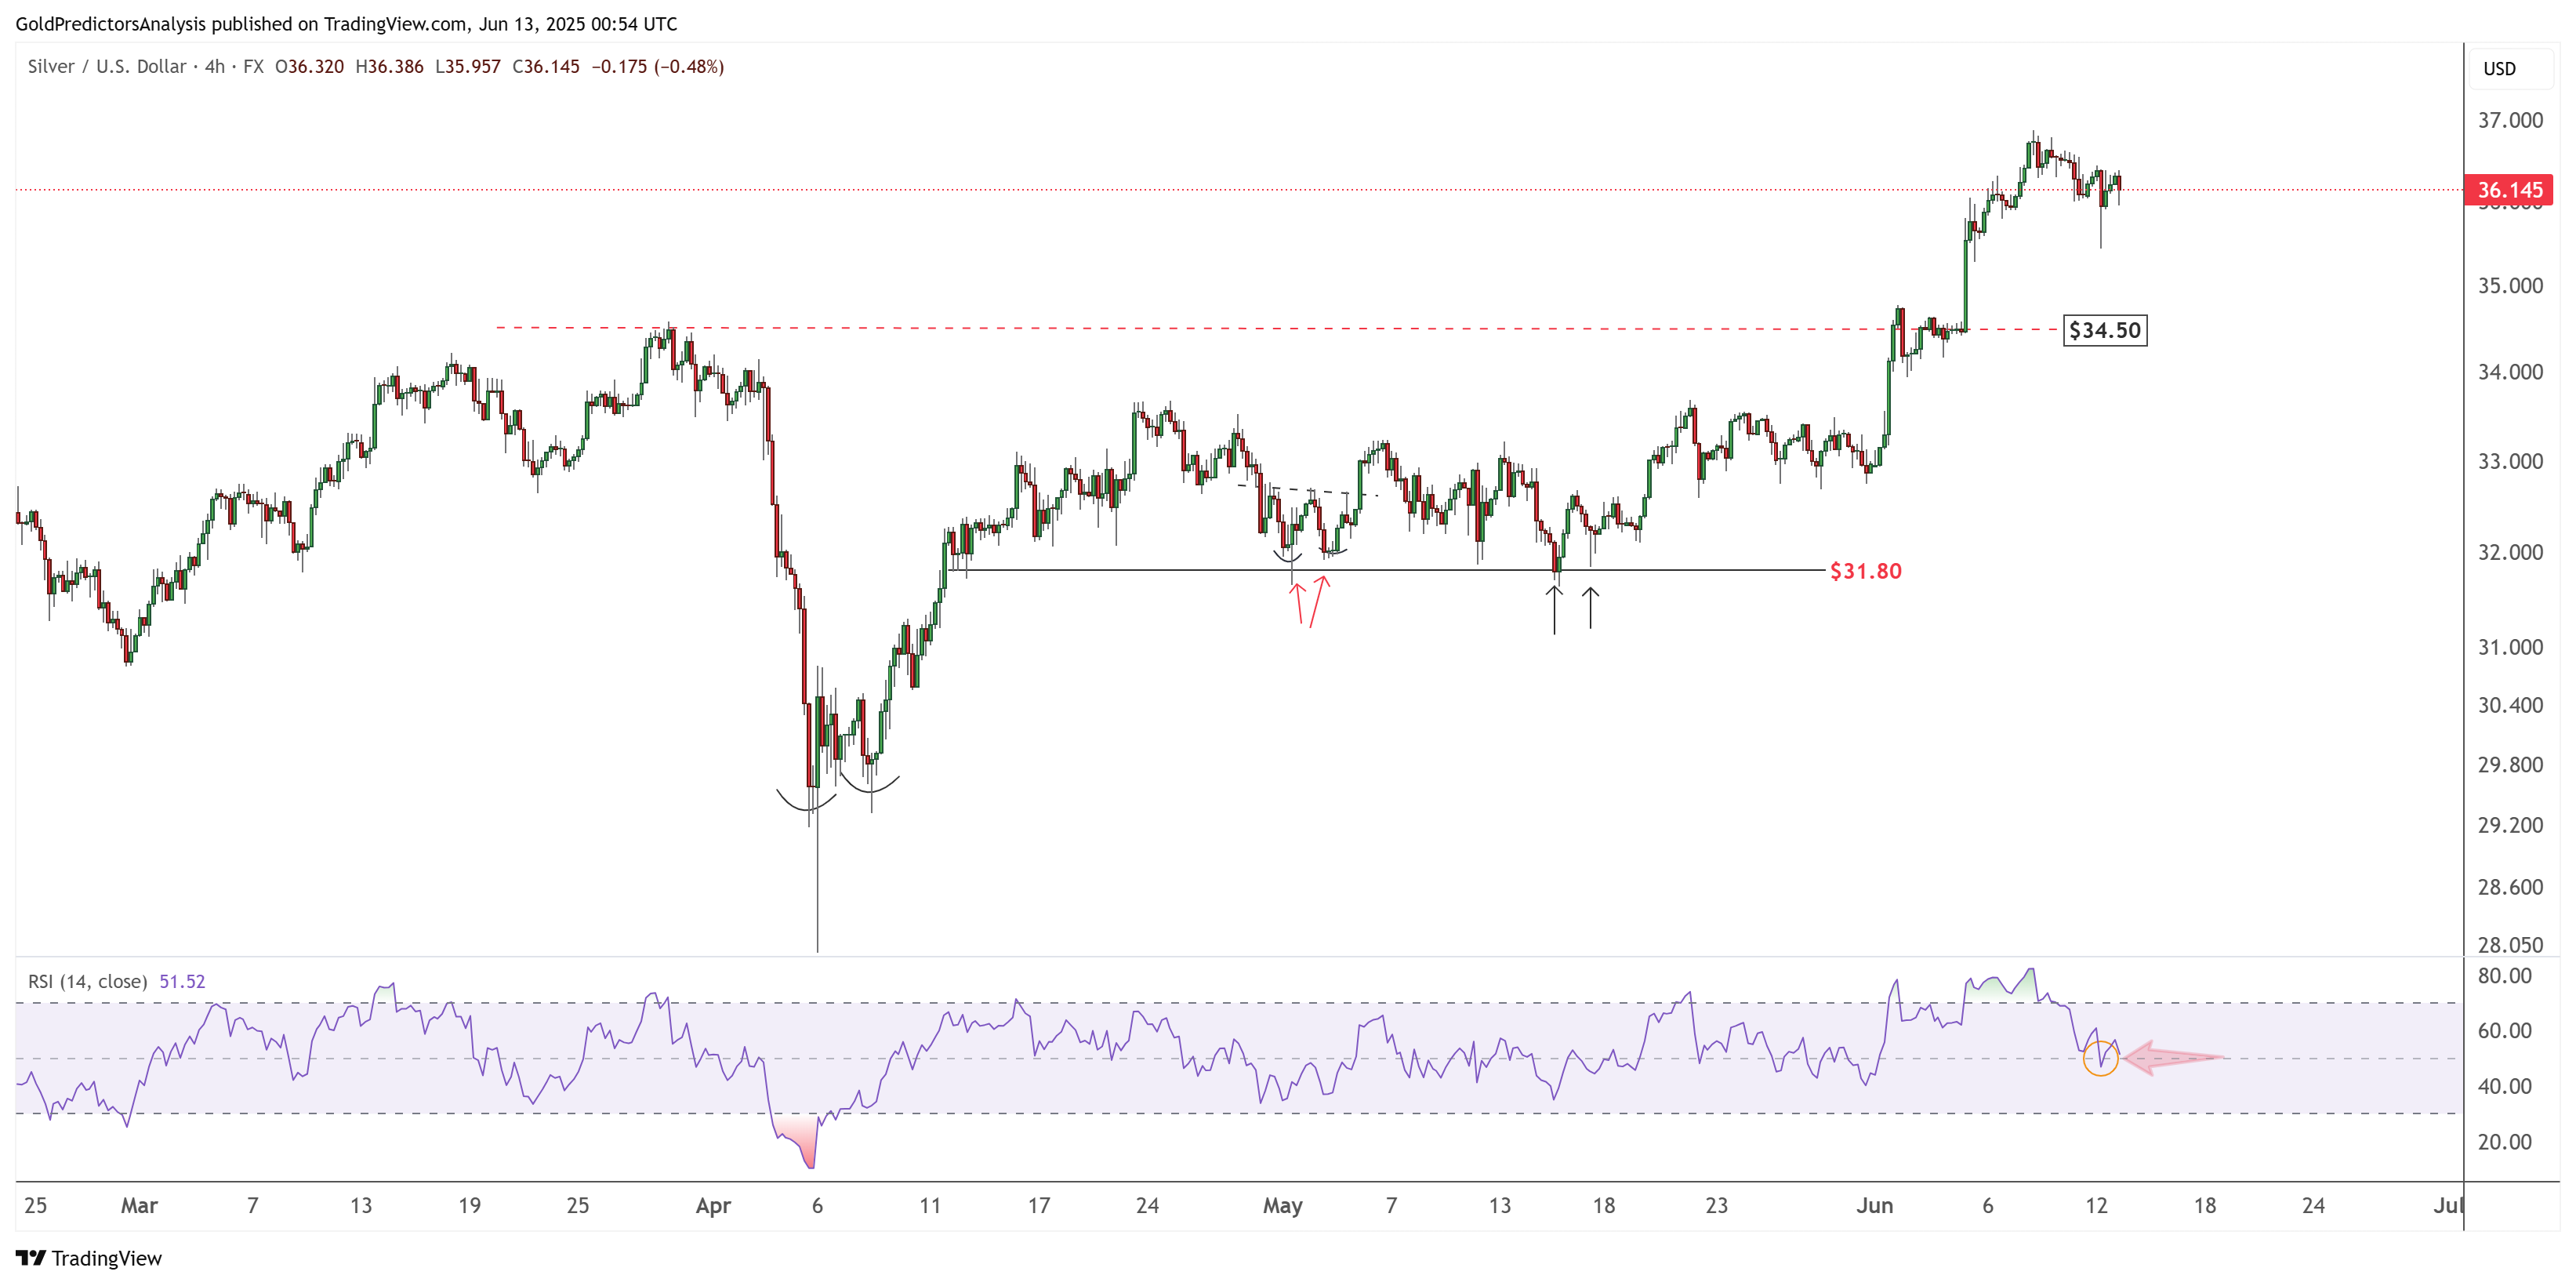
XAGUSD 4-Hour Chart – Positive Price Development
The 4-hour chart for spot silver shows that the price corrected from the $36.80 resistance and found strong support at $35.40. This pullback was driven by extremely overbought conditions on the 4-hour chart, with the price finding support near the mid-level of the RSI around the $35.40 area. A break above $36.80 would likely trigger another surge in silver prices.
US Dollar Index Technical Analysis
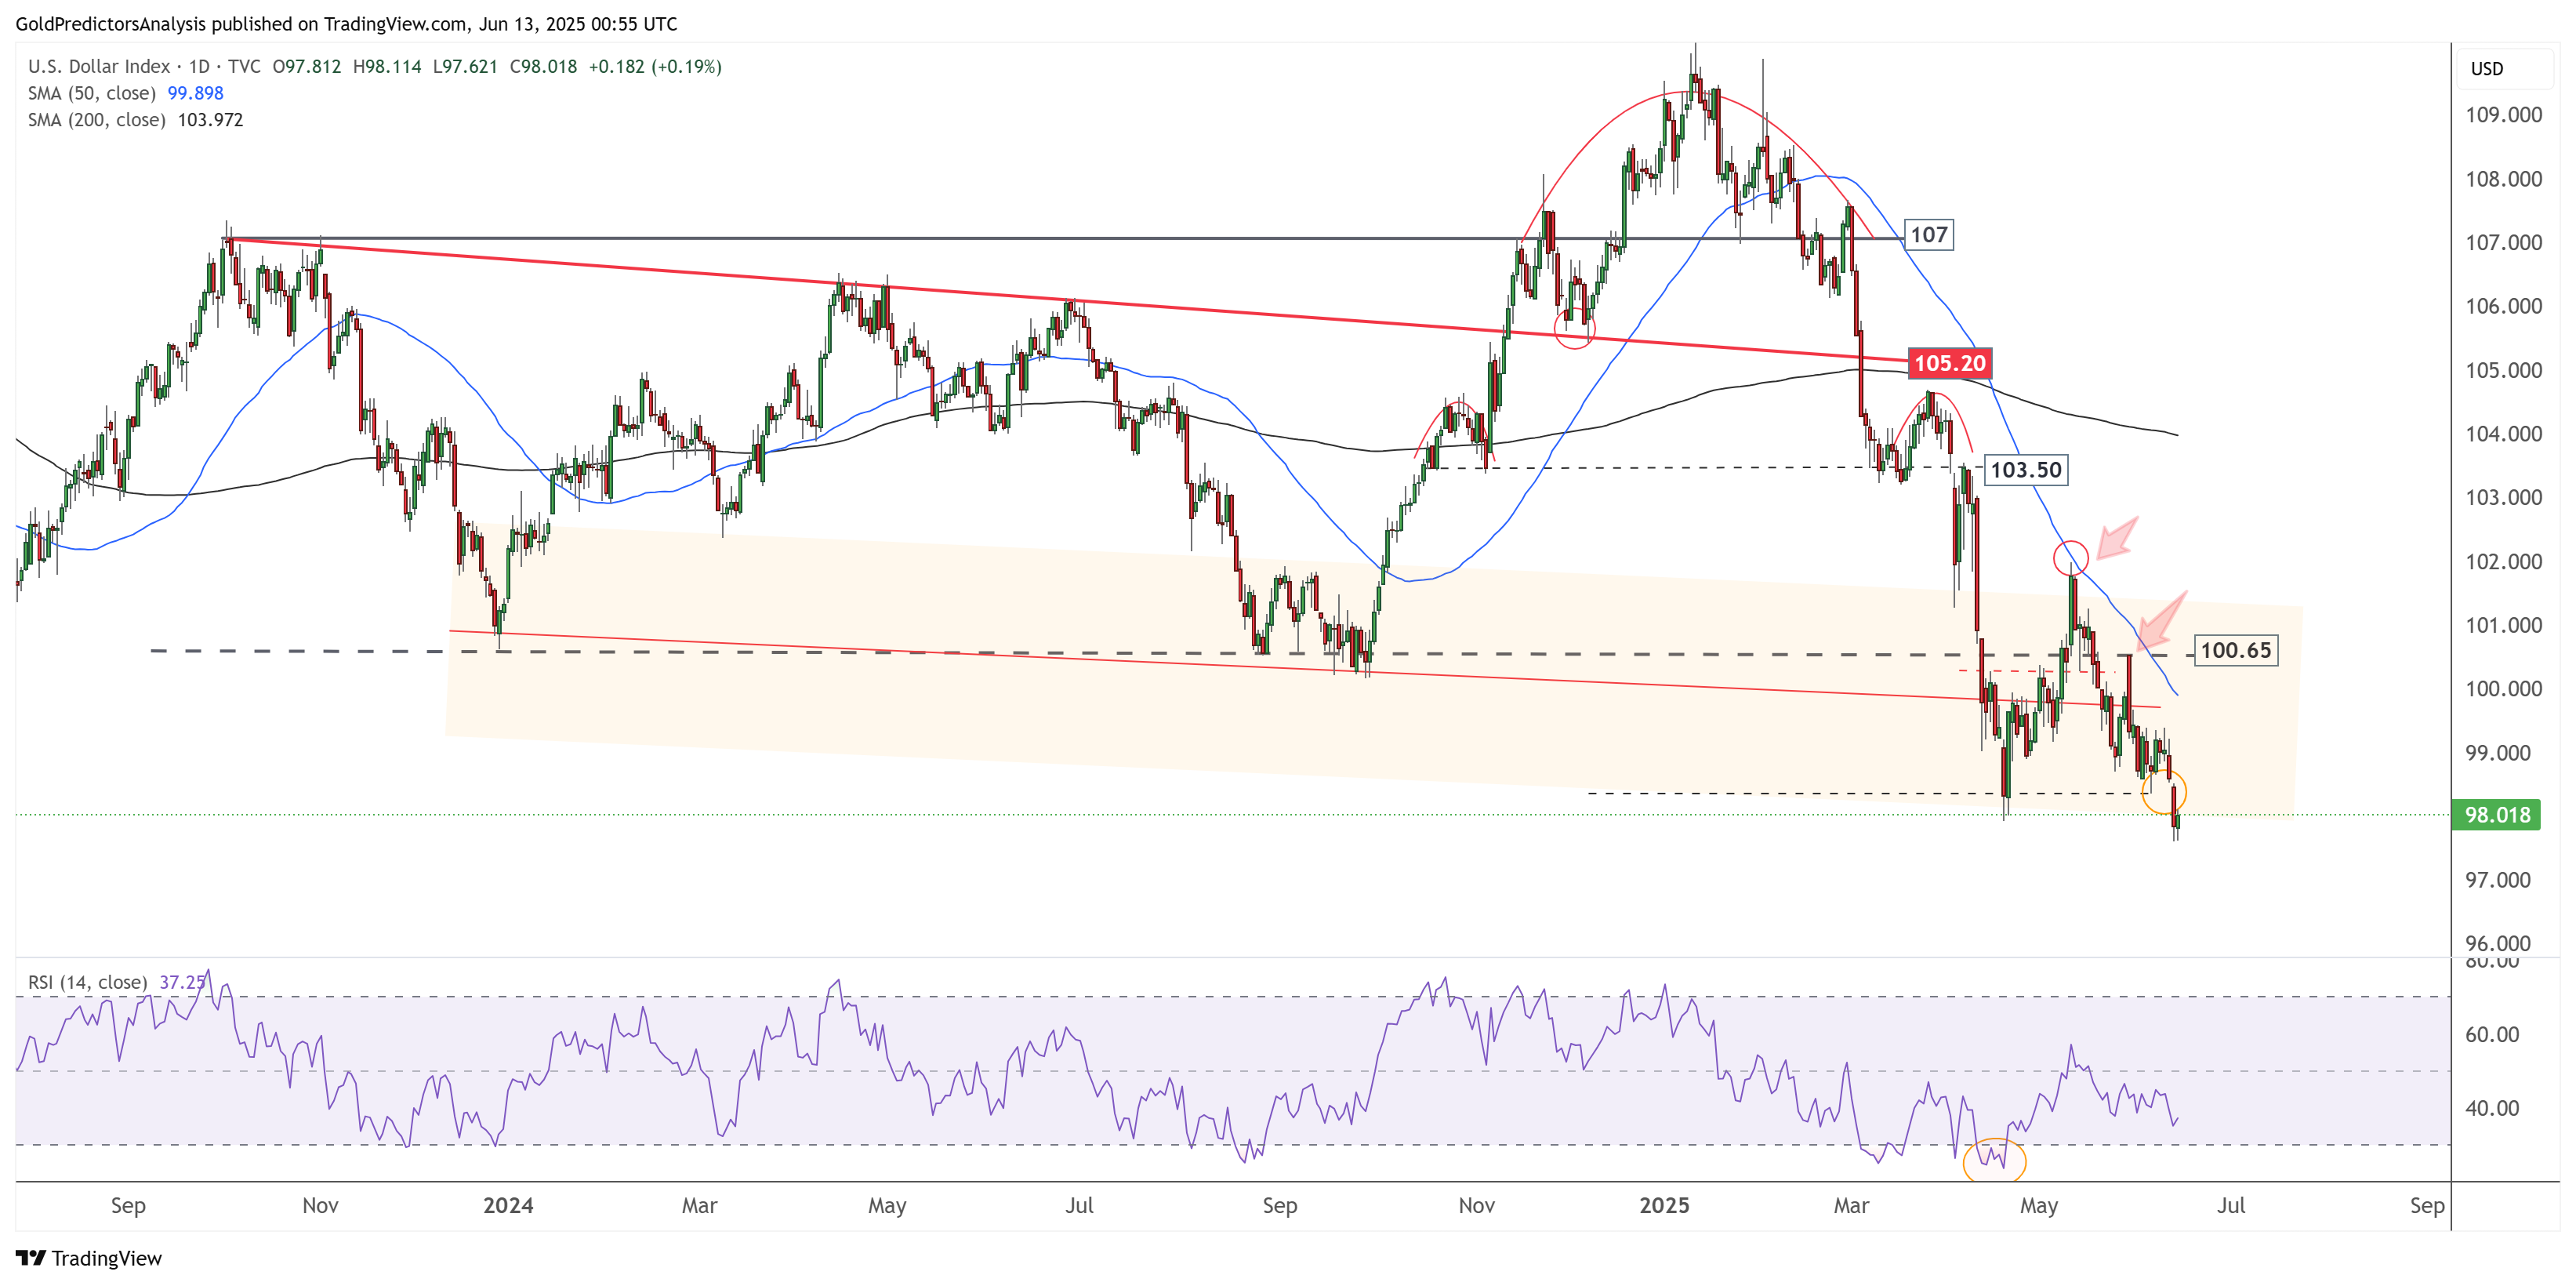
US Dollar Daily – Bearish Pressure
The daily chart for the US Dollar Index shows that it is attempting to break below the 98 area. The emergence of a bearish head and shoulders pattern indicates strong downward pressure. Therefore, a break below 98 could initiate a move toward the 96 area. The RSI is consolidating below the mid-level, further signaling bearish momentum.
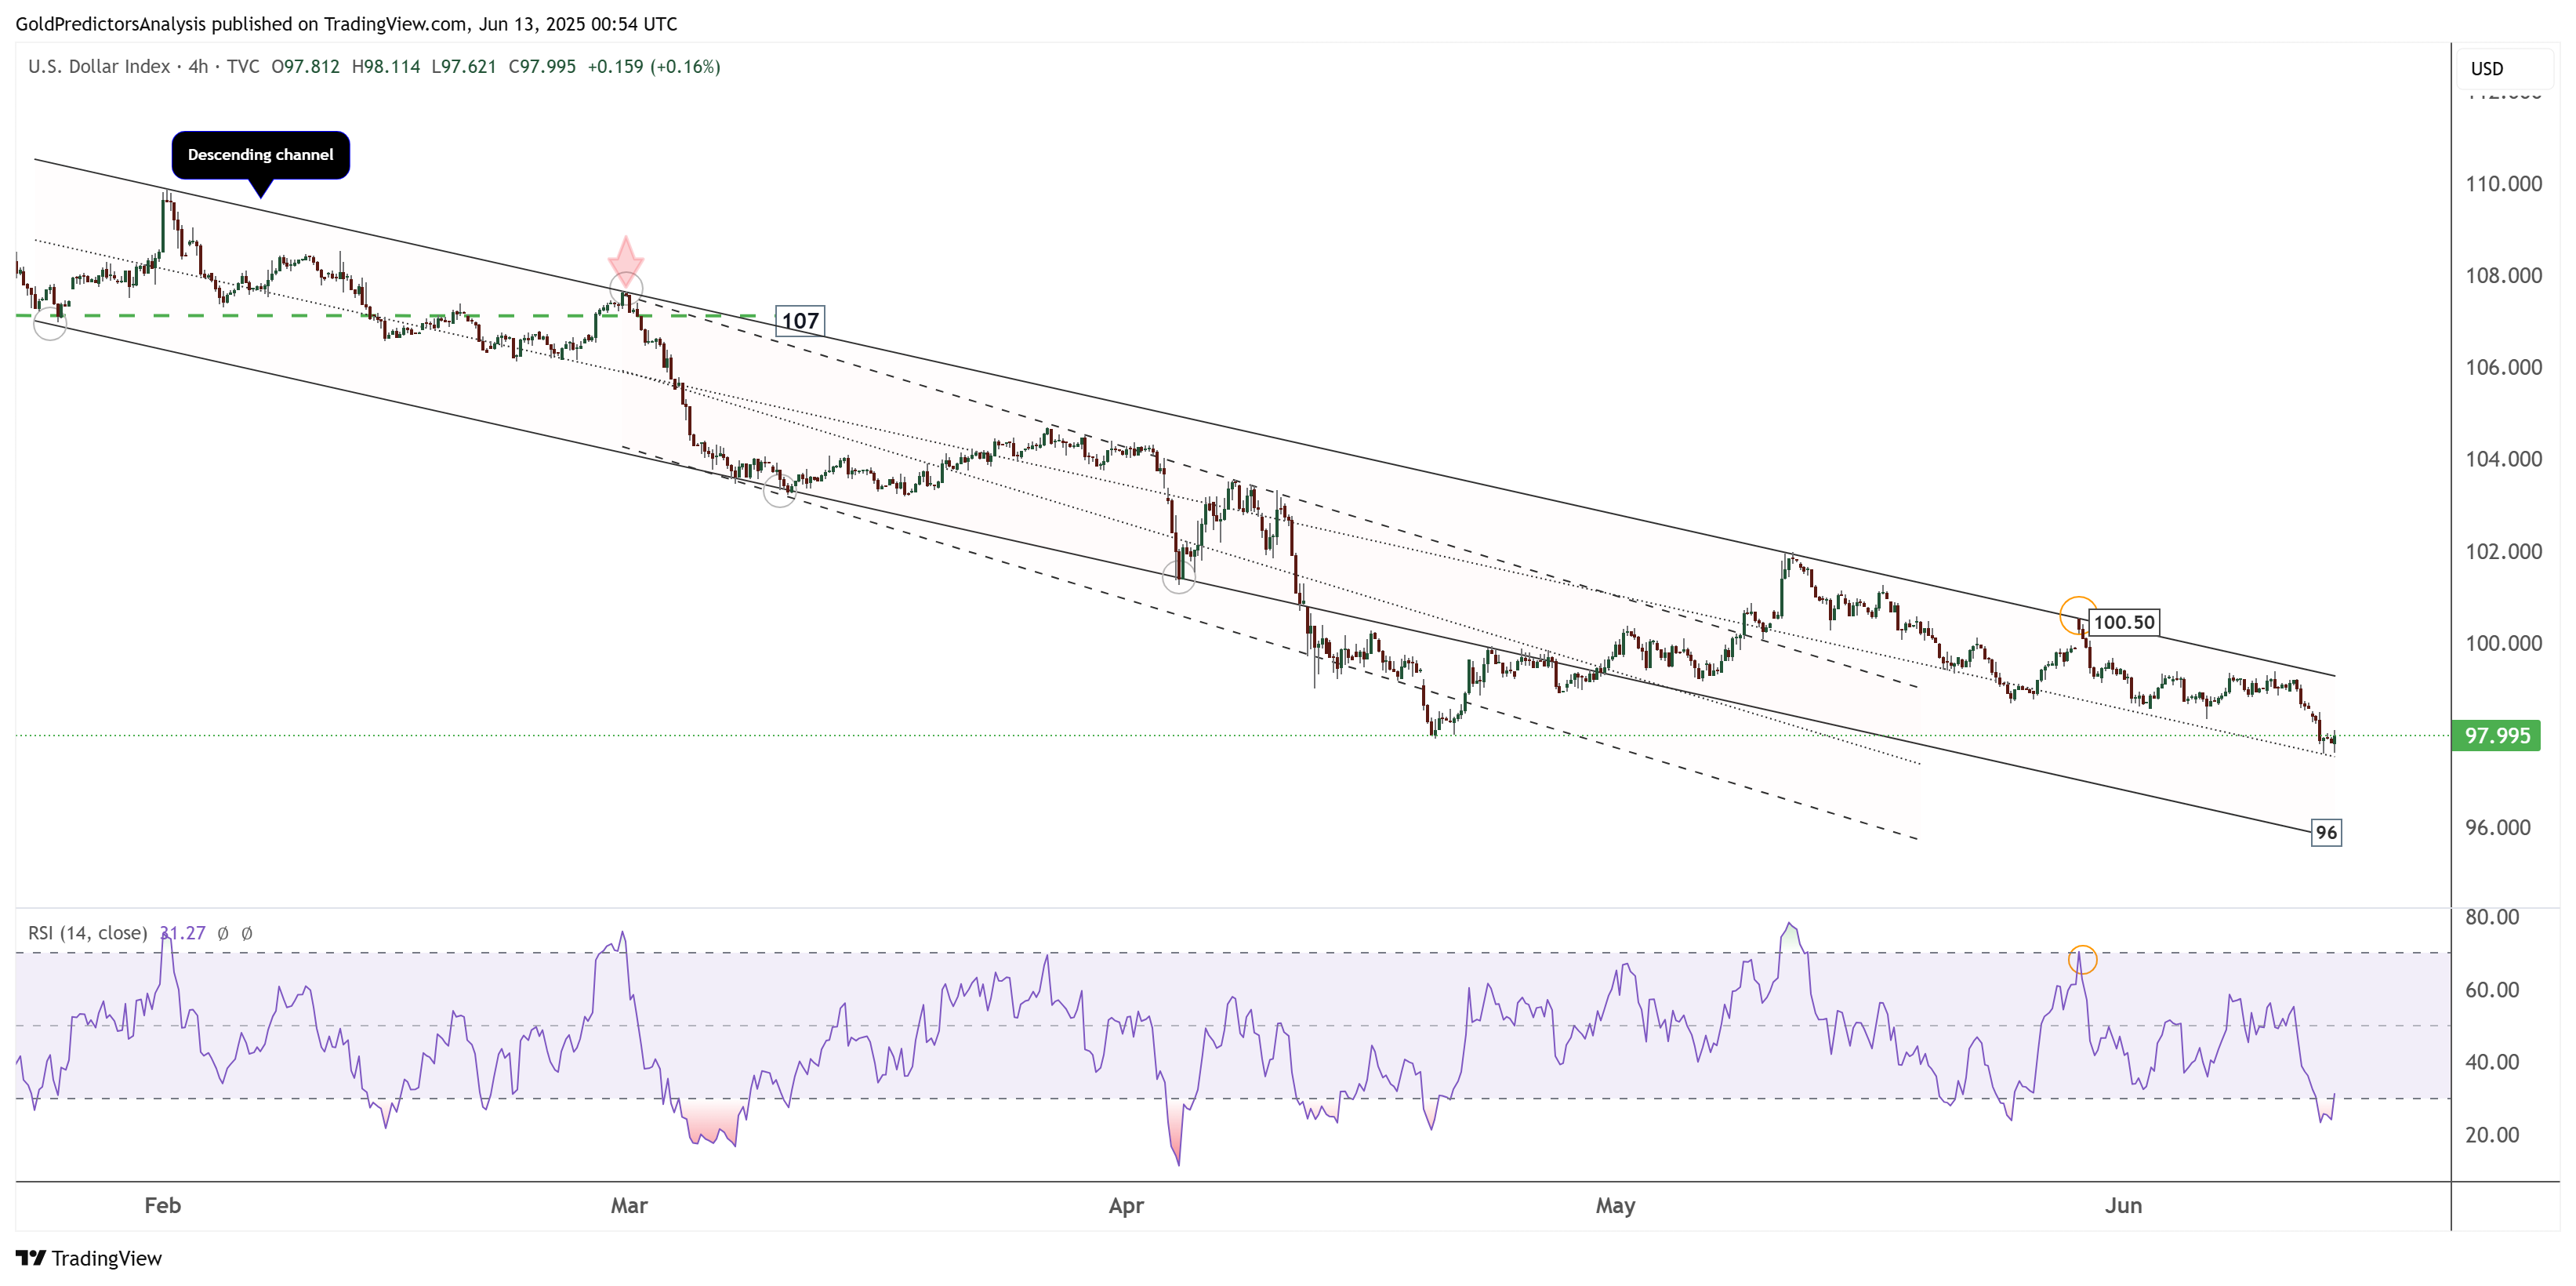
US Dollar 4-Hour Chart – Descending Channel
The 4-hour chart for the US Dollar Index shows that it is trading within a descending channel. As long as the index remains below 100.50, bearish pressure is likely to persist. However, the RSI on the 4-hour chart has reached oversold conditions, indicating a potential short-term rebound. This rebound may present another selling opportunity for the US dollar.
About the Author
Bob MasonChief Crypto Boss
123456789 30 He has written extensively for a broader audience and his current focus is on developments relating to the financial markets including, but not limited to currencies, commodities, alternative asset classes, and global equities.


Advertisement