
Advertisement
Advertisement
Gold Price Forecast: Extends Rally, but Bearish Candlestick Hints at Pullback
By:
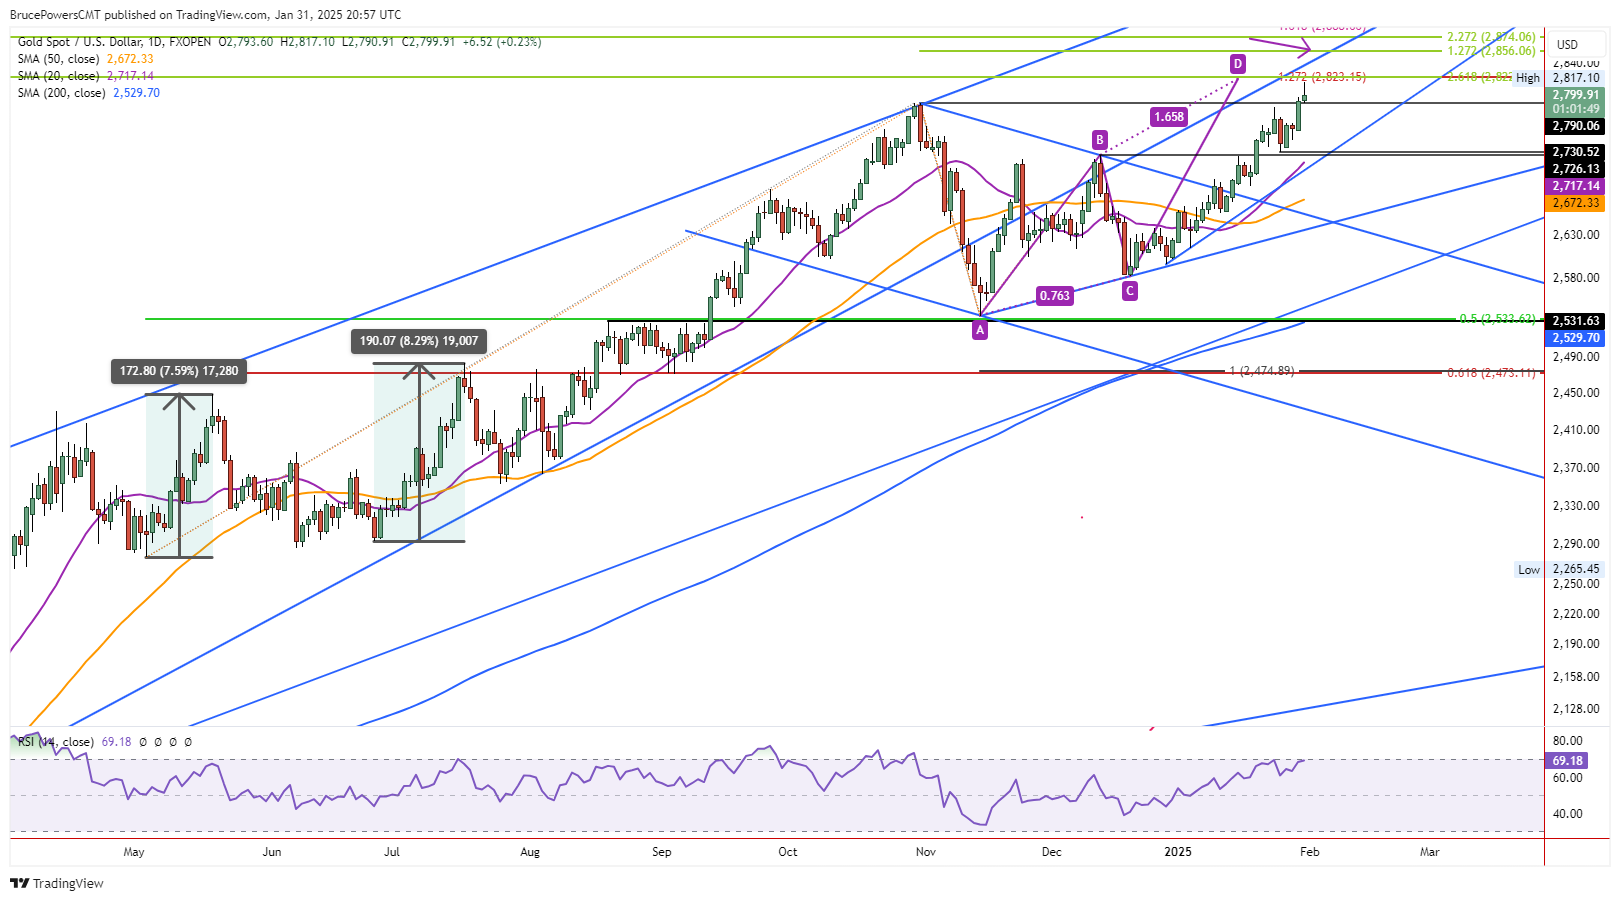
Gold’s bullish run reached 2,817 before retreating, forming a potential bearish one-day reversal pattern, with key support levels at 2,731, 2,717, and 2,672 in focus.
Gold continued to advance on Friday following Thursday’s breakout to a new trend high, which confirmed a continuation of the long-term bull trend. A new record high of 2,817 was reached on Friday, which was followed by a bearish intraday decline. Strong intraday selling pressure subsequently put the price of gold in the lower quarter of the day’s trading range, which is where it stands at the time of this writing.
A daily close in the lower quarter of the range will put gold in a weak short-term position, as it looks likely to end the day with a bearish shooting star candlestick pattern. Nonetheless, Thursday’s closing price was the highest historically at 2,793 and Friday may yet exceed that level. That is a bullish longer-term metric.
Bearish Pattern Setting Up
Today’s short-term bearish indications could be followed by a deeper pullback. A drop below today’s low of 2,791 will trigger a continuation of the decline and could establish at least a temporary top at today’s high. Further, it would likely lead to a deeper pullback and lower prices. Howe much lower, remains to be seen.
There are a couple of key trend support areas that need to be considered for potential support. The initial target would be the 20-Day MA, now at 2,717. Since the 20-Day line is rising, the price level it represents will also increase. Nearby that moving average is a small rising trendline that can be used along with the 20-Day MA for extra guidance if approached.
Levels to Watch if Pullback Continues
Further down is the more significance potential support around the 50-Day MA, currently at 2,672. Since it is used to help identify the intermediate trend, it has greater potential significance than the 20-Day line. It has only recently begun to move out of a consolidation zone where it has less impact and is less reliable.
However, earlier potential support levels to watch are the minor recent swing low of 2,731 along with the prior interim swing high of 2,726 (B). Prior resistance levels can turn into support on the way down and how the price of gold reacts to those price areas can provide clues about changes in supply and demand.
For a look at all of today’s economic events, check out our economic calendar.
About the Author
Bruce Powerscontributor
Bruce has been involved in the financial markets for over 20 years, as an analyst, trader, educator, and writer.
Latest news and analysis


Advertisement