
Advertisement
Advertisement
Gold Price Forecast: Faces Key Resistance at 50-Day MA
By:
Gold consolidates at 2,345, facing resistance and potential bearish indicators, with key support levels crucial for maintaining the current uptrend price structure.
In this article:
Gold further consolidated on Friday, testing resistance around the 50-Day MA, which is currently at 2,345. The 20-Day MA converged with the 50-Day line today and marks the same price area. A bearish sign will be indicated if the 20-Day line crosses below the 50-Day. Gold is sandwiched between the moving averages at the top and last week’s low of 2,287 at the bottom of a five-day price range.
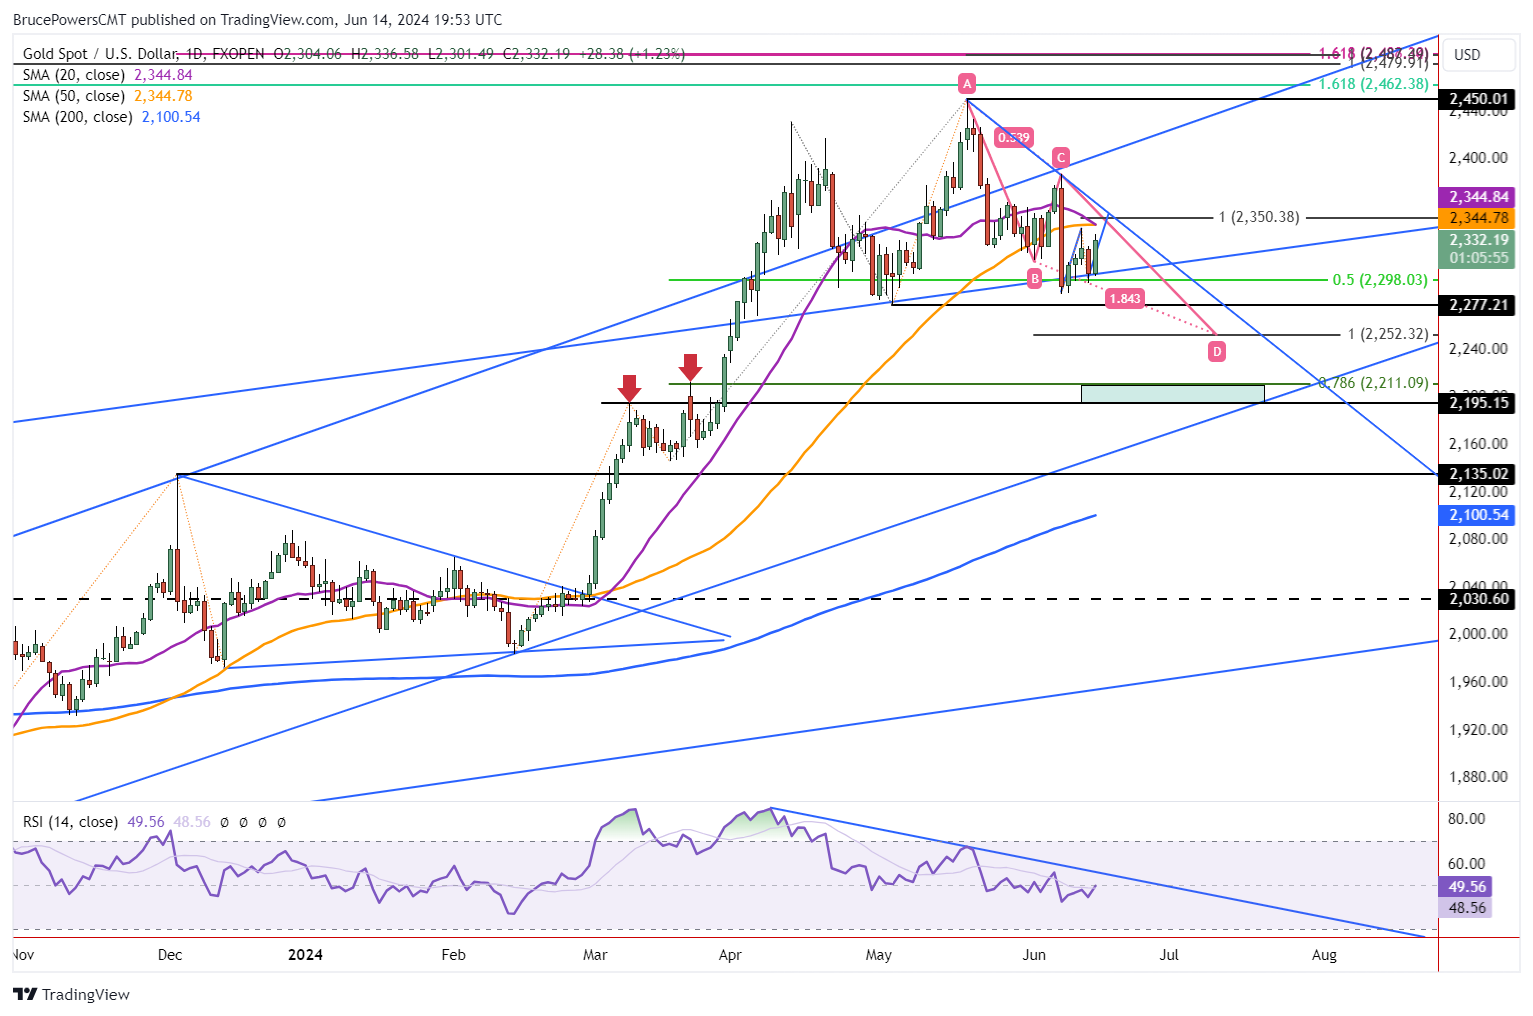
Resistance Zone from 2,345 to 2,350
Another price area to keep an eye on for resistance is a little above the 50-Day MA at 2,350. That price completes an initial target for a small rising ABCD pattern. And it is contained within last Friday’s wide price range, which by itself influences choppy price action. Last Friday’s high of 2,388 began with a bullish breakout but ended with a failed breakout and a bearish close. Therefore, given the current price patterns in gold, it looks like a decisive rally above 2,388 would be needed to sustain a bull reversal into new record highs. Otherwise, support remains at risk of being broken to the downside.
Weakness Likely Below 2,301
Weakness would next be indicated on a drop below today’s low of 2,301 and further confirmed on a decline below last week’s low of 2,287. Regardless, the recent swing low of 2,277 cannot be ignored. It defines the price structure of the uptrend and is a key price level to watch for support. If it is approached a third time it seems likely to give way to lower prices. Certainly, characteristics of the trend can change, but a drop below it would be considered bearish and provide a clearer sign that sellers were in charge.
Lower Pivots Start With 2,252
Downside pivots are at 2,252, 2,211, and 2,195. The lower price level takes on greater importance given its nearby neighbor, the uptrend line. Also, the trendline takes on greater significance since it would follow a successful test of resistance around the top line of a parallel trend channel most recently. Once price reverses from resistance in a chart pattern it tends to at least attempt if not reach the other side of the pattern. For gold that dynamic would be complete if it reaches the price area of the uptrend line.
For a look at all of today’s economic events, check out our economic calendar.
About the Author
Bruce Powerscontributor
Bruce has been involved in the financial markets for over 20 years, as an analyst, trader, educator, and writer.
Did you find this article useful?
Latest news and analysis


Advertisement