
Advertisement
Advertisement
Gold Price Forecast: Gold Pulls Back After Failed Breakout
By:
After an unsuccessful breakout, gold is testing key support levels. A deeper correction could follow if $2,853 breaks, with downside targets at $2,790 and $2,754.
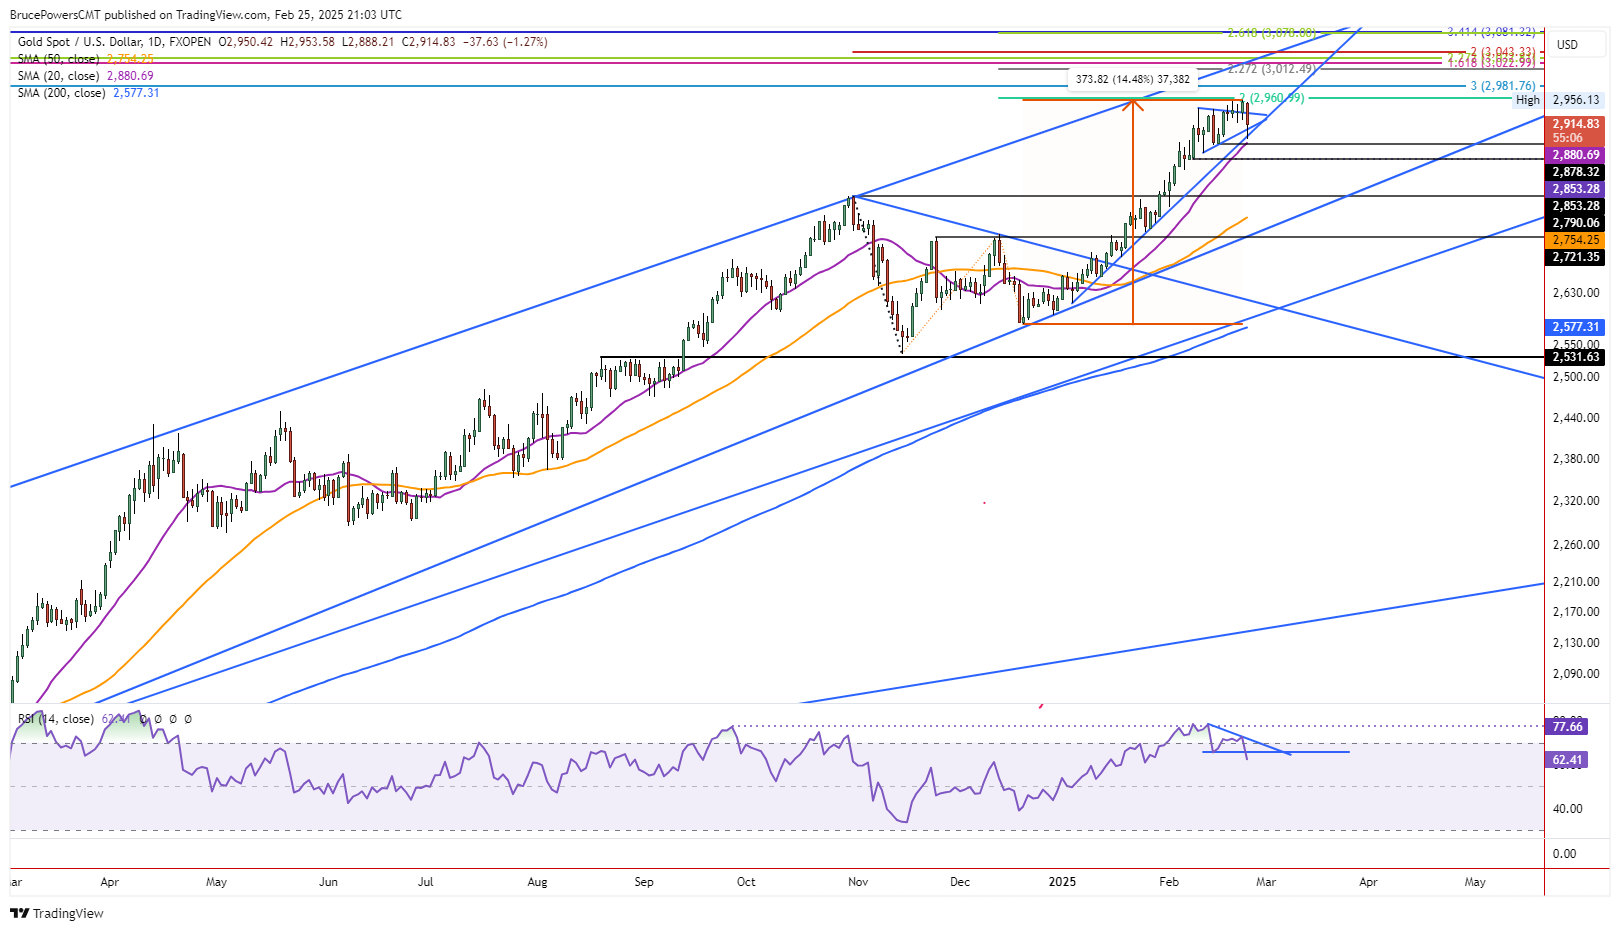
Gold has failed to follow through on a bull breakout of a pennant pattern triggered last week. On Tuesday, it fell sharply to a six-day low of $2,888 thereby triggering a breakdown of the pennant as the lower boundary line was broken. Support for the day was subsequently seen around a rising trendline. Gold looks set to end the day in a bearish position in the lower third of the day’s trading range. Since a failure of the bull breakout just occurred, it seems likely that potential support levels will be further tested before buyers take back control again.
20-Day MA is Key Trend Support
Key dynamic trend support is established by the 20-Day MA, currently at $2,880. The uptrend line provides a guide, but the 20-Day line deserves greater respect as the trendline could be broken while support of the 20-Day line is retained. Therefore, the 20-Day line along with previous price levels may help determine the potential scope of a pullback.
Last week’s low at $2,878 and the three-week low at $2,853 are weekly support levels to be aware of. The weekly pattern shows eight consecutive weeks of higher weekly highs and higher lows, including this week. However, this week is not over and if last week’s low fails to hold as support, the bullish weekly pattern will start to change. That could lead to a deeper correction or further consolidation.
Bearish RSI Divergence
There is a bearish divergence showing in the relative strength index (RSI) and a decline below a minor swing low on the RSI line just triggered. This would seem to be supportive of deeper or longer correction. Certainly, it shows a weakening of demand. Nonetheless, the reaction around key price levels will help provide a roadmap.
If the three-week low at $2,853 is broken, lower prices become more likely. A test of support at the prior trend high of $2,790 from October is an obvious potential downside target. It is followed by the 50-Day MA, around $2,754 currently. There is also an uptrend line slightly below the 50-Day line currently. It should also provide guidance if approached.
Strong Recent Performance
From the interim swing low of $2,582 in December, gold advanced by as much as $374 or 14.5% in 45 trading days, as of Monday’s new trend high of $2,956. That is a solid performance but also an indication some degree of rest is needed before gold it read to trend higher again.
For a look at all of today’s economic events, check out our economic calendar.
About the Author
Bruce Powerscontributor
Bruce has been involved in the financial markets for over 20 years, as an analyst, trader, educator, and writer.
Latest news and analysis


Advertisement