
Advertisement
Advertisement
Gold Price Forecast: Hits $3,005 Before Reversing, Key Levels to Watch
By:
Gold hit a record $3,005 before reversing, forming a bearish shooting star pattern. Key support lies at $2,956, while a breakout above $3,005 signals further gains.
Gold rallied to a new record high of $3,005 before encountering resistance and reversing intraday. The high achieved a previously identified target at the 127.2% extension of a rising ABCD pattern. It shows a harmonic relationship between the two upswings of the pattern. This is a good example of why these types of relationships are tracked.
Subsequently, gold it set to end the day with a bearish shooting star candlestick pattern. At the time of this writing, trading continues near the lows of the day, which is currently $2,978. However, given the strong bullish breakout to new record highs this week, caution is warranted as a bearish pullback would be counter to the prevailing strong uptrend on multiple time frames.
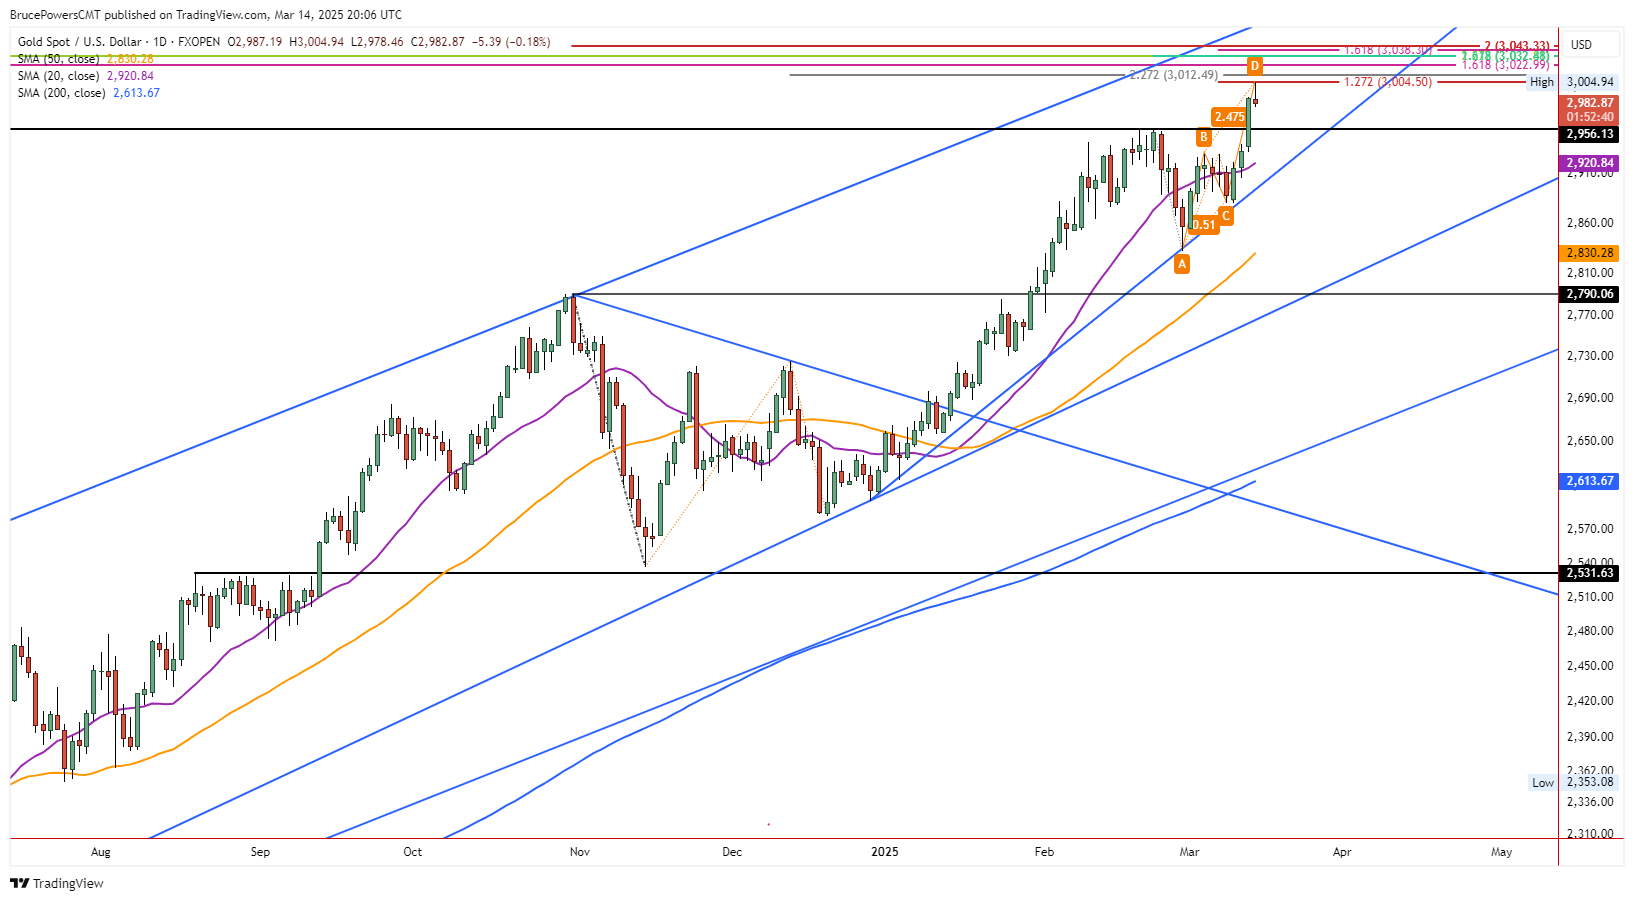
Short-term Bearish Signal Below $2,978
A pullback to test previous resistance levels as support will be indicated with a drop below today’s low. The price zone around the prior high at $2,956 is the first price level to watch for support. Further down is the recent swing high and a weekly high at $2,930. It may soon be joined by the 20-Day MA, currently at $2,921, as it is rising and should soon converge with the $2,930 price area or rise above it.
Weekly Bullish Signal Confirmed
In addition to a breakout to new record highs this week, gold broke out of an inside week continuation pattern on a rally above last week’s high of $2,930. The subsequent bullish performance showed strong demand and bullish momentum. A bearish pullback after reaching a target zone is normal and healthy for the trend as gains are digested.
It should lead to a bullish setup following a test of support. Despite the potential support levels mentioned above, there is a possibility that gold falls as far as the nearby trendline before the retracement is completed as it marks a lower trend support area for the advance that began from the December lows.
First Higher Target at $3,012
Regardless of the potential short-term bearish indications, a decisive breakout above Friday’s high of $3,005 shows continued strength and the possibility that higher prices can be reached before a pullback. There are five potential higher targets from $3,012 to $3,043. It is hard to say which one might be the more significant price level, but the price target derived from the longest pattern is $3,033.
For a look at all of today’s economic events, check out our economic calendar.
About the Author
Bruce Powerscontributor
Bruce has been involved in the financial markets for over 20 years, as an analyst, trader, educator, and writer.
Did you find this article useful?
Latest news and analysis


Advertisement