
Advertisement
Advertisement
Gold (XAUUSD) Price Forecast: Risks Deeper Pullback Amid Bearish Patterns
By:
A potential breakdown in gold looms as resistance holds and last week’s bearish candlestick pattern threatens deeper losses toward the 50-Day moving average.
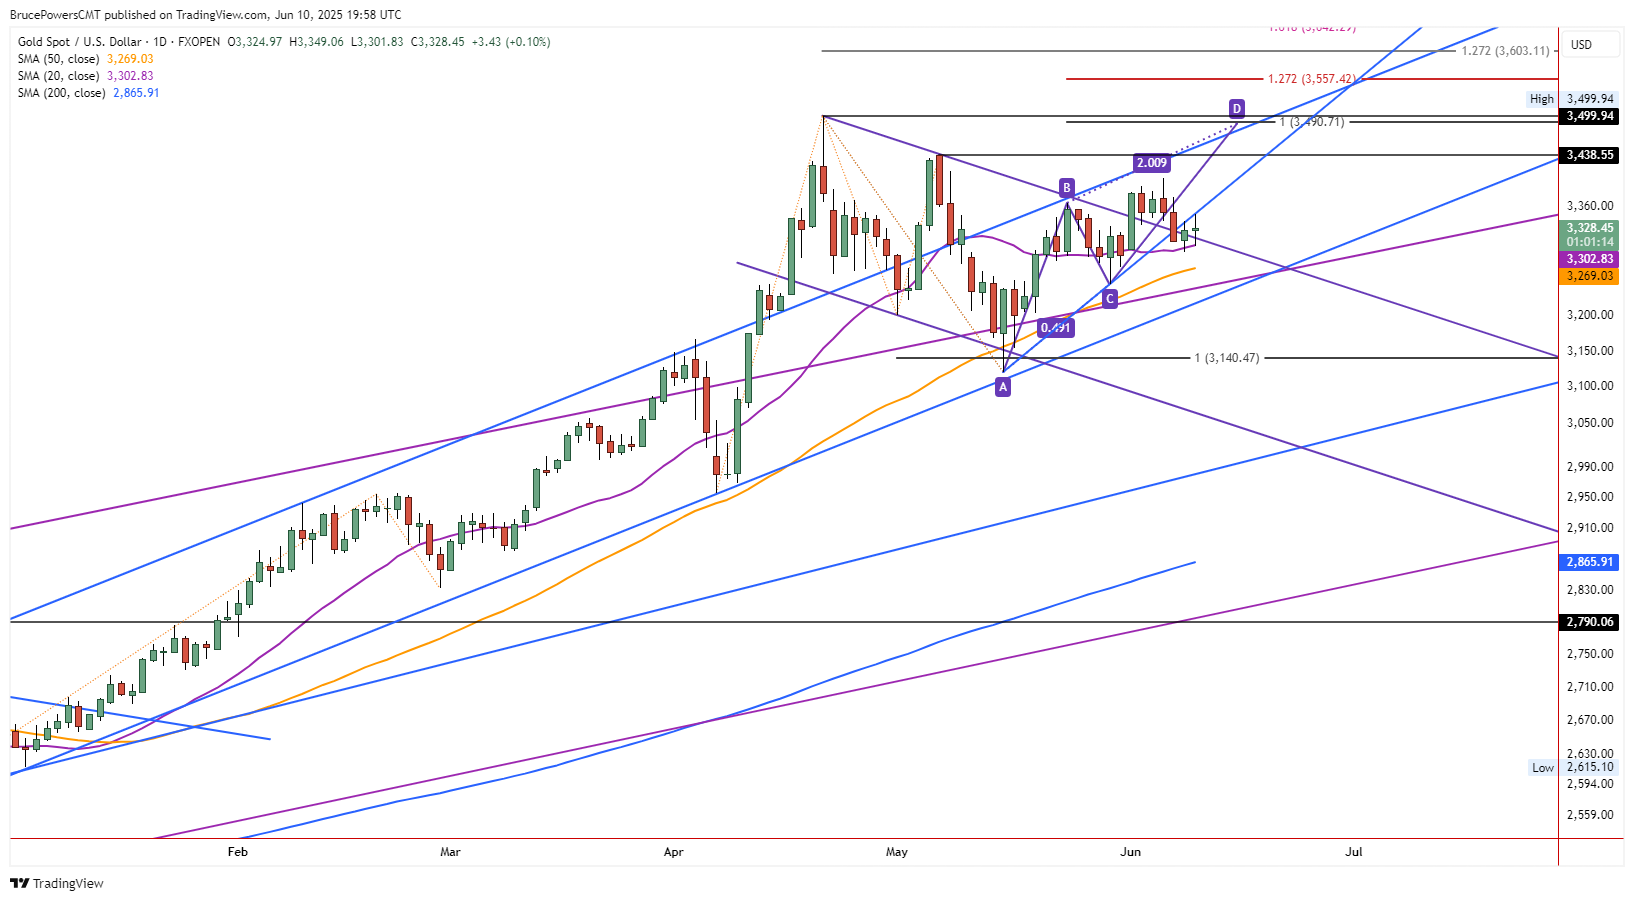
Gold successfully found support around the 20-Day MA on Tuesday, for the second day in a row. This followed a one-day breakout above Monday’s high to $3,349. That was a successful test of resistance at an internal trendline that followed a drop below the line last Friday. A higher daily low and higher high was established for the day, but resistance was clearly seen at the trendline. That is bearish behavior unless today’s session ends above Monday’s high of $3,338. Currently, trading continues near the opening price, putting gold in a position to end the day with a doji candlestick pattern.
Sellers Remain in Charge
Price behavior indicates continued downward pressure on the price of gold after Friday’s bearish trendline break. Once a prior dynamic support line is shown as resistance, the bear trend (short, three-day pullback so far) is indicating it could continue. Since support has been seen around the 20-Day line two days in a row, a decline below it may provide an early bearish signal. Currently, the 20-Day MA is at $3,303, but the more significant price level is at Monday’s low of $3,293.
50-Day Moving Average May be Tested
A decline below Monday’s low would put gold in a position to quickly decline to potential support around the 50-Day MA (orange), now at $3,265. Notice that the two prior downswings in gold eventually found support around the 50-Day line and bounced. There is also potential support at the interim swing low of $3,245 (C), if the 50-Day line fails to reverse sentiment.
Weekly Bearish Candle
Last week’s candlestick pattern was a bearish shooting star, and the week closed very close to the low for the week. Therefore, a sustained drop below last week’s low of $3,296 will trigger the bearish pattern and it could lead to a period of more aggressive selling that’s been seen recently.
Resistance at Friday’s High
On the upside, be aware that although a rise above today’s high is short-term bullish, potential resistance remains a little higher around the trendline. Last Friday’s high of $3,375 would need to be exceeded before a clearer sign of strength than a reclaim of a trendline. However, a sustained rise above the trendline will be a sign of strength.
For a look at all of today’s economic events, check out our economic calendar.
About the Author
Bruce Powerscontributor
Bruce has been involved in the financial markets for over 20 years, as an analyst, trader, educator, and writer.


Advertisement