
Advertisement
Advertisement
XRP News Today: XRP Price Dips as ETF Hopes Ride on SEC Court Filing; BTC at $108k
By:
Key Points:
- XRP investors eye June 16 as the SEC must file a court update—will a settlement breakthrough emerge?
- A withdrawn SEC appeal could open the door to long-awaited XRP-spot ETF approvals in the US.
- XRP holds support despite legal headwinds; bullish traders target $2.65 and potentially $3 in coming weeks.

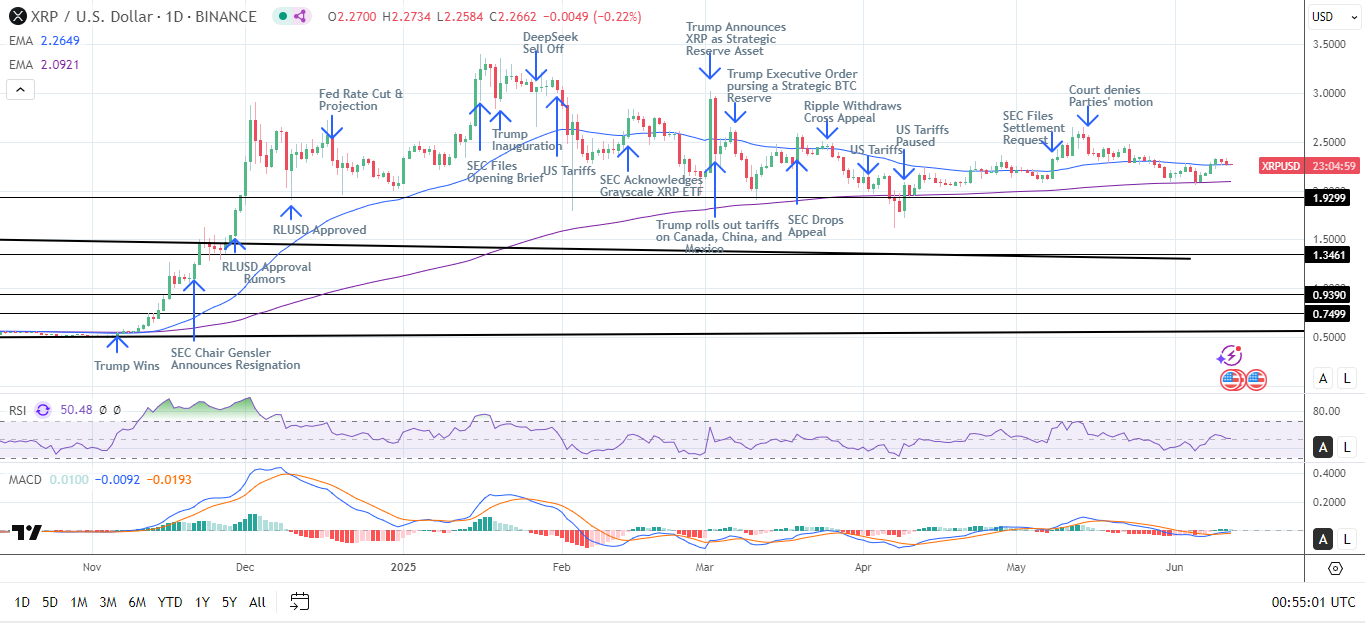
SEC vs. Ripple: Court Deadline Fast Approaching
Market focus remained on the ongoing SEC vs. Ripple case on Wednesday, June 11, as a Court of Appeal’s deadline fast approached. Significantly, the SEC must submit a settlement progress report to the Court of Appeals by June 16. However, there has been scant progress toward a settlement since Judge Analisa Torres rejected the SEC’s request for an indicative ruling on settlement terms.
The hope that the SEC will file a second request for an indicative ruling has waned, though the agency is known for last-minute motions. In April, the SEC filed its motion for a 60-day abeyance the same day Ripple was scheduled to file its appeal-related opening brief.
While the SEC’s wheels are moving slowly in the Ripple case, price trends suggest investors remain optimistic about a favorable end to the case.
Notably, an SEC appeal withdrawal could expedite the approval of pending XRP-spot ETF applications, a potentially significant demand source. Under former SEC Chair Gary Gensler’s watch, the agency appealed against the Programmatic Sales of XRP ruling. A successful appeal could force US exchanges to delist XRP and potentially end prospects for an XRP-spot ETF market.
XRP Price Outlook: Court Filings and ETF News
XRP dropped 1.53% on Wednesday, June 11, following Tuesday’s 0.66% loss to close at $2.2711. The token tracked the broader market, which declined 1.54% to a total crypto market cap of $2.37 trillion.
The near-term XRP trends remain contingent on legal developments and ETF-related headlines. A break above $2.35 could open the door to retesting resistance at $2.50 and the May 12 high of $2.6553. A sustained move through $2.6553 may bring $3 and the record high of $3.5505 into play. Conversely, a drop below the 50-day EMA could expose the 200-day EMA and the $1.9299 support level.
For a deeper dive, see our full XRP forecast here.
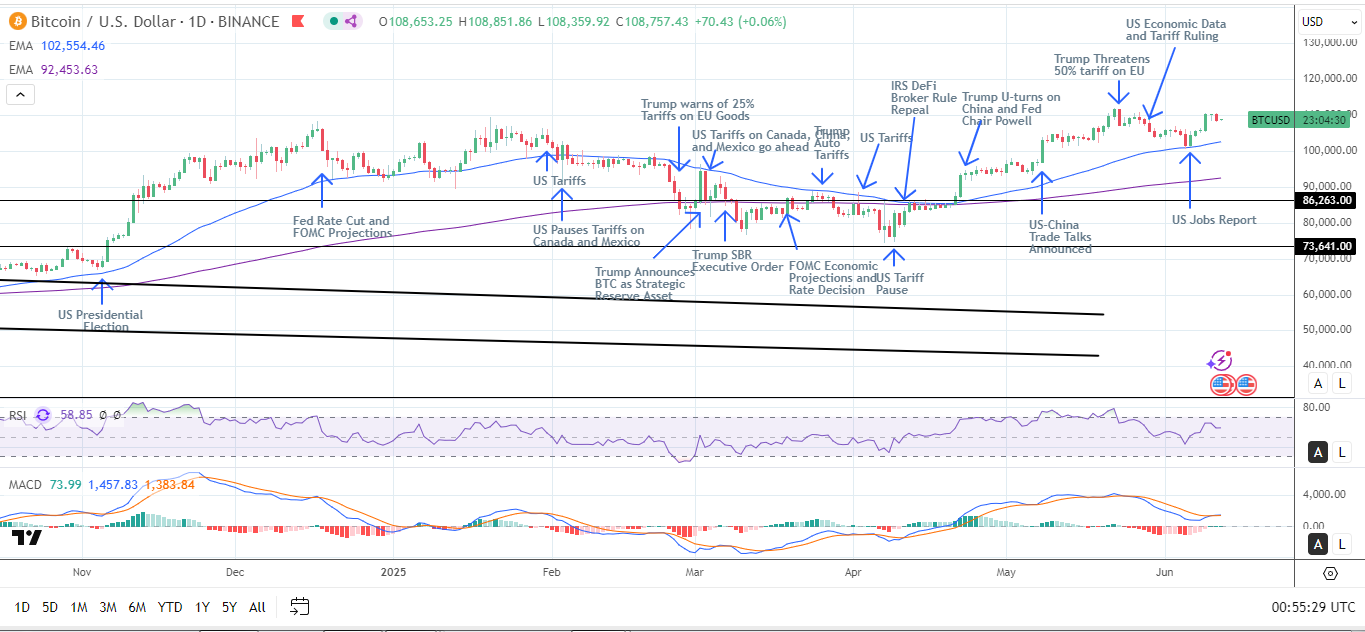
Bitcoin Sees Volatility Spike on US Inflation, Middle East Tensions, and Tariffs
XRP dropped for a second consecutive session, while bitcoin (BTC) snapped a five-day winning streak. A softer-than-expected US CPI Report boosted demand for risk assets, sending BTC to a session high of $110,428. Core inflation held steady at 2.8% in May, while headline inflation rose from 2.3% in April to 2.4% in May. Economists expected a core inflation rate of 2.9% and an annual inflation rate of 2.5%.
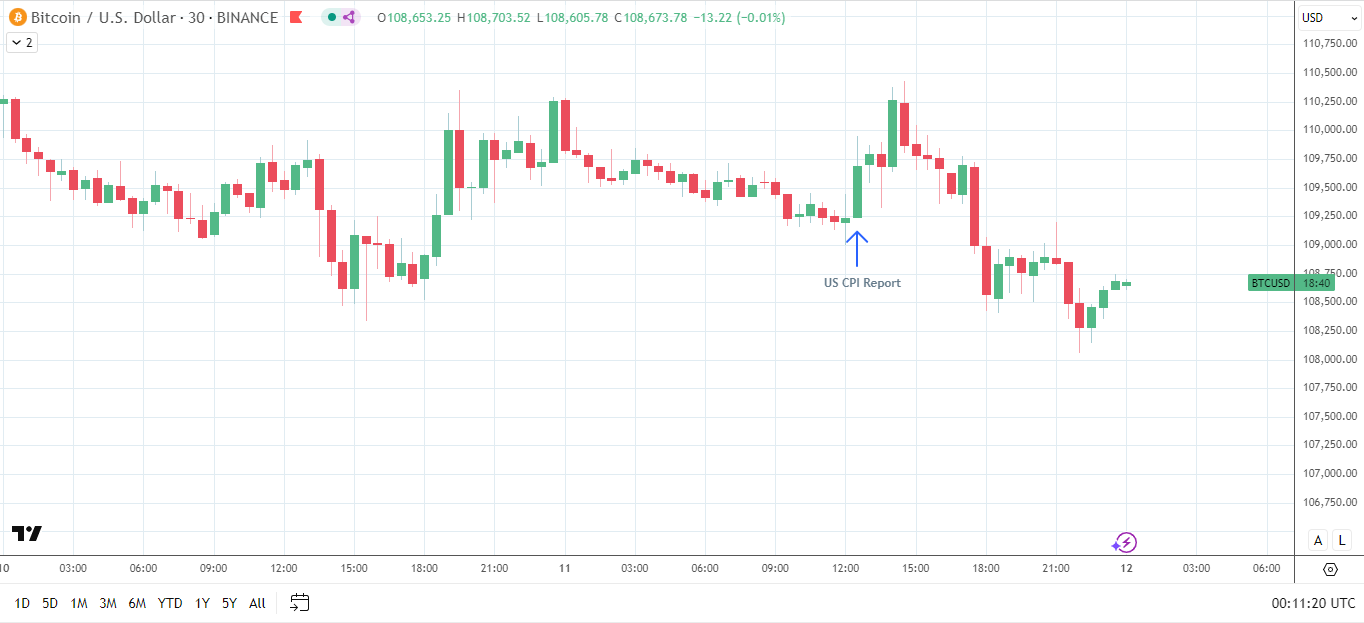
However, an escalation in Middle East tensions spooked investors later in the Wednesday session. There were reports of an Iranian official warning that Tehran would strike US assets in the region if nuclear negotiations failed as talks stall. The news coincided with speculation that Israel may strike Iran, adding to market tensions.
Meanwhile, President Trump also impacted sentiment, threatening unilateral tariff rates. Addressing reporters, the US President reportedly stated that he would send letters to trading partners, setting tariffs within the next one-and-a-half to two weeks.
Tariff hikes could drive import prices higher, potentially fueling inflationary pressures. Rising inflation may leave the Fed in a higher-for-longer rate stance.
US BTC-Spot ETF Demand Wanes
Market sentiment toward rising tensions in the Middle East and tariffs impacted demand for US BTC-spot ETFs. According to Farside Investors, key flow trends for June 11 included:
- Fidelity Wise Origin Bitcoin Fund (FBTC) saw net inflows of $11.9 million.
- Franklin Bitcoin ETF (EZBC) posted net inflows of $6.3 million.
Excluding pending flow data for BlackRock’s (BLK) iShares Bitcoin Trust (IBIT), the US BTC-spot ETF market saw total inflows of $18.2 million, down from Tuesday’s inflows of $431.2 million.
BTC-spot ETF flows continue to influence BTC’s supply-demand balance and price trends.
BTC Price Outlook: Trade Developments, US Data, and ETF Flows
BTC fell 1.42% on June 11, following a flat performance on Tuesday, closing at $108,687. Short-term price trends depend on legislative developments, incoming US economic data, trade developments, and ETF flows.
Potential scenarios:
- Bearish Scenario: Escalating trade tensions, legislation roadblocks, hotter US inflation, and ETF outflows could send BTC toward the 50-day Exponential Moving Average (EMA) and $100,000.
- Bullish Scenario: Easing trade tensions, bipartisan support for crypto bills, cooler US inflation, and ETF inflows could send BTC above the all-time high of $111,917.
What to Watch
Investors should focus on court filings in the Ripple case, legislative news, trade developments, Middle East tensions, and ETF flow trends. These factors remain pivotal for XRP and BTC price trajectories and could determine whether either token revisits record highs.
Explore analyst forecasts on where XRP and BTC may head next as legal and political factors unfold.
About the Author
Bob MasonChief Crypto Boss
123456789 30 He has written extensively for a broader audience and his current focus is on developments relating to the financial markets including, but not limited to currencies, commodities, alternative asset classes, and global equities.


Advertisement