
Advertisement
Advertisement
NASDAQ 100, Dow Jones 30 and S&P 500 Forecast – US Indices Are Looking to Recover
Published: Oct 16, 2024, 12:35 GMT+00:00
The US Indices are all looking to recover during the early hours of Wednesday, as the market is trying to turn things around against the overall selloff during the ugly Tuesday session. Ultimately, this is a set of indices that are looking to the Federal Reserve and its monetary policy.
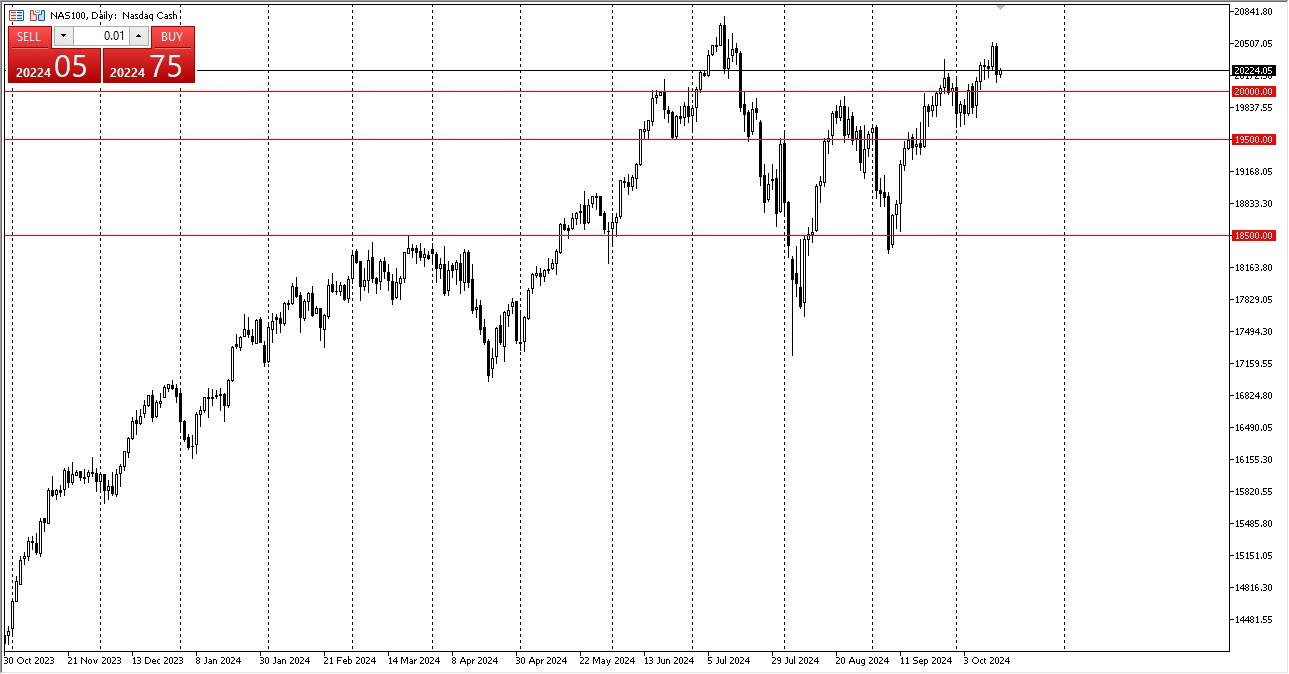
NASDAQ 100 Technical Analysis – A Bounce in the Making?
The NASDAQ 100 bounced slightly in the early hours on Wednesday as it looks like we are clawing back some of those fairly unexpected selling moves during the Tuesday session. At this point, we need to pay close attention to the $20,000 level underneath, which should offer a certain amount of psychological support as well as market memory based upon the previous action that we have seen at that level.
The candlestick for the trading session on Tuesday was rather ugly, but it wouldn’t be the first time we saw a sudden and sharp pullback in this market. By its very nature, it’s probably worth noting that the NASDAQ 100 is volatile anyway. At this point, all eyes will be on the 20,500 level, which seemed to trigger quite a bit of selling during the previous session.
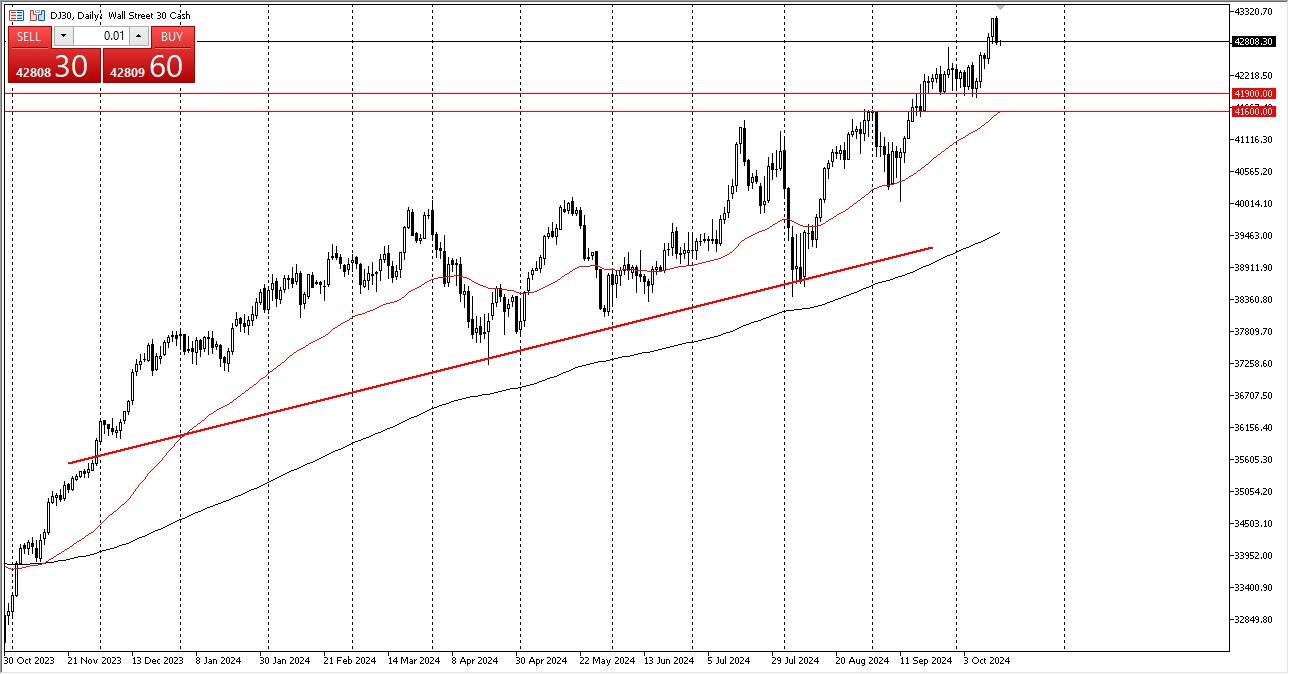
Dow Jones 30 Technical Analysis – Dow Jones a Laggard, So Far
In the Dow Jones 30, we are stabilizing, and in the early hours, hanging around the 42,800 level. While we have not bounced as much as we have in the NASDAQ 100, the Dow Jones 30 has been an extraordinarily bullish market as of late, perhaps based on the idea of interest rate cuts causing a stimulative effect in the US economy, which of course would have major implications for some of the big blue chip companies.
Furthermore, you have to keep in mind that the dividend play is very much alive and well as rates had been falling. So that also has helped the Dow Jones 30. At this point I look at the 41,900 level as a floor. I also look at 43,300 above as a potential barrier. If we can break above that, it more likely than not will open the door to the 45,000 level.
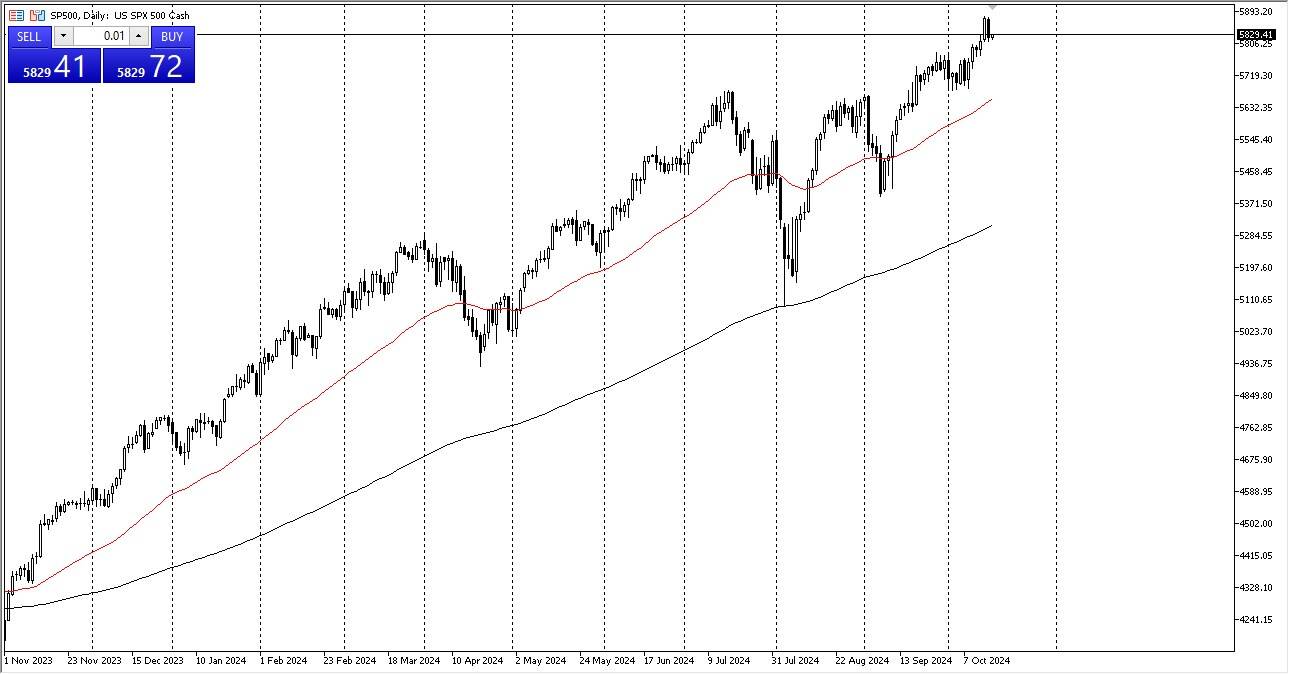
S&P 500 Technical Analysis – The Market See Inflows
The S&P 500 also bounced a little bit during the early hours on Wednesday, as it looks like we are going to try to claw back some of those losses from the previous session. At this juncture, it is a very bullish market, and even if we did have a bit of a pullback, one would have to think that somewhere around the 5,800 level, there would be support, and then again, somewhere near 5,700.
The 50 day EMA is racing to catch the 5,700 level, so it all ties together quite nicely. I do think it’s probably more likely than not we consolidate a bit for a while, so that means we should see short-term upward pressure in a limited scope. Eventually though, I don’t see anything on this chart that tells me that the S&P 500 won’t be looking to reach the 6,000 level between now and the end of the year.
About the Author
Christopher Lewisauthor
Christopher Lewis is an experienced trader that specializes in technical analysis and markets prediction. Chris has over 20 years of experience across a wide variety of markets and assets - currencies, indices, and commodities.


Advertisement