
Advertisement
Advertisement
Trump Trade War Drives Divergence in NASDAQ, S&P 500 and Dow Jones Performance
By:
Key Points:
- S&P 500 has broken record levels and continues to show bullish momentum.
- Nasdaq has also broken record levels and maintains strong upward momentum.
- Dow Jones Industrial Average lags and awaits a possible breakout amid the stock rally.

Trump reignited trade tensions by threatening new tariffs on Canadian goods after abruptly halting talks over Canada’s proposed digital services tax. The tax, which targeted US tech giants such as Amazon (AMZN), Meta, Google (GOOG), and Apple (AAPL), was set to take effect on Monday. Canada scrapped the tax hours before its launch to avoid further escalation and revive negotiations.
The Canadian government confirmed it will halt tax collection and repeal the legislation. The move followed pressure from the US, which labelled the tax a direct attack on American firms. Prime Minister Mark Carney and President Trump have now set a July 21 deadline to finalise a new trade agreement.
Meanwhile, the US trade deal with Britain has taken effect, lowering tariffs on British car exports and removing duties on aircraft parts. However, steel and aluminium tariffs remain unresolved. Britain faces a potential 50% tariff hike starting July 9 if no resolution is reached. These developments have shaken expectations for trade policy and stirred market volatility.
Stock Markets Rally as Trade Tensions Resurface and Financial Conditions Improve
The S&P 500 surged past the 6,100 level and reached a new all-time high. The Nasdaq 100 also hit a new record, confirming strong upward momentum. However, the Dow Jones 30 has not yet broken out, signalling divergence among major indexes.
Financial conditions continue to improve. The Chicago Fed National Financial Conditions Index dropped to -0.51 on June 20.

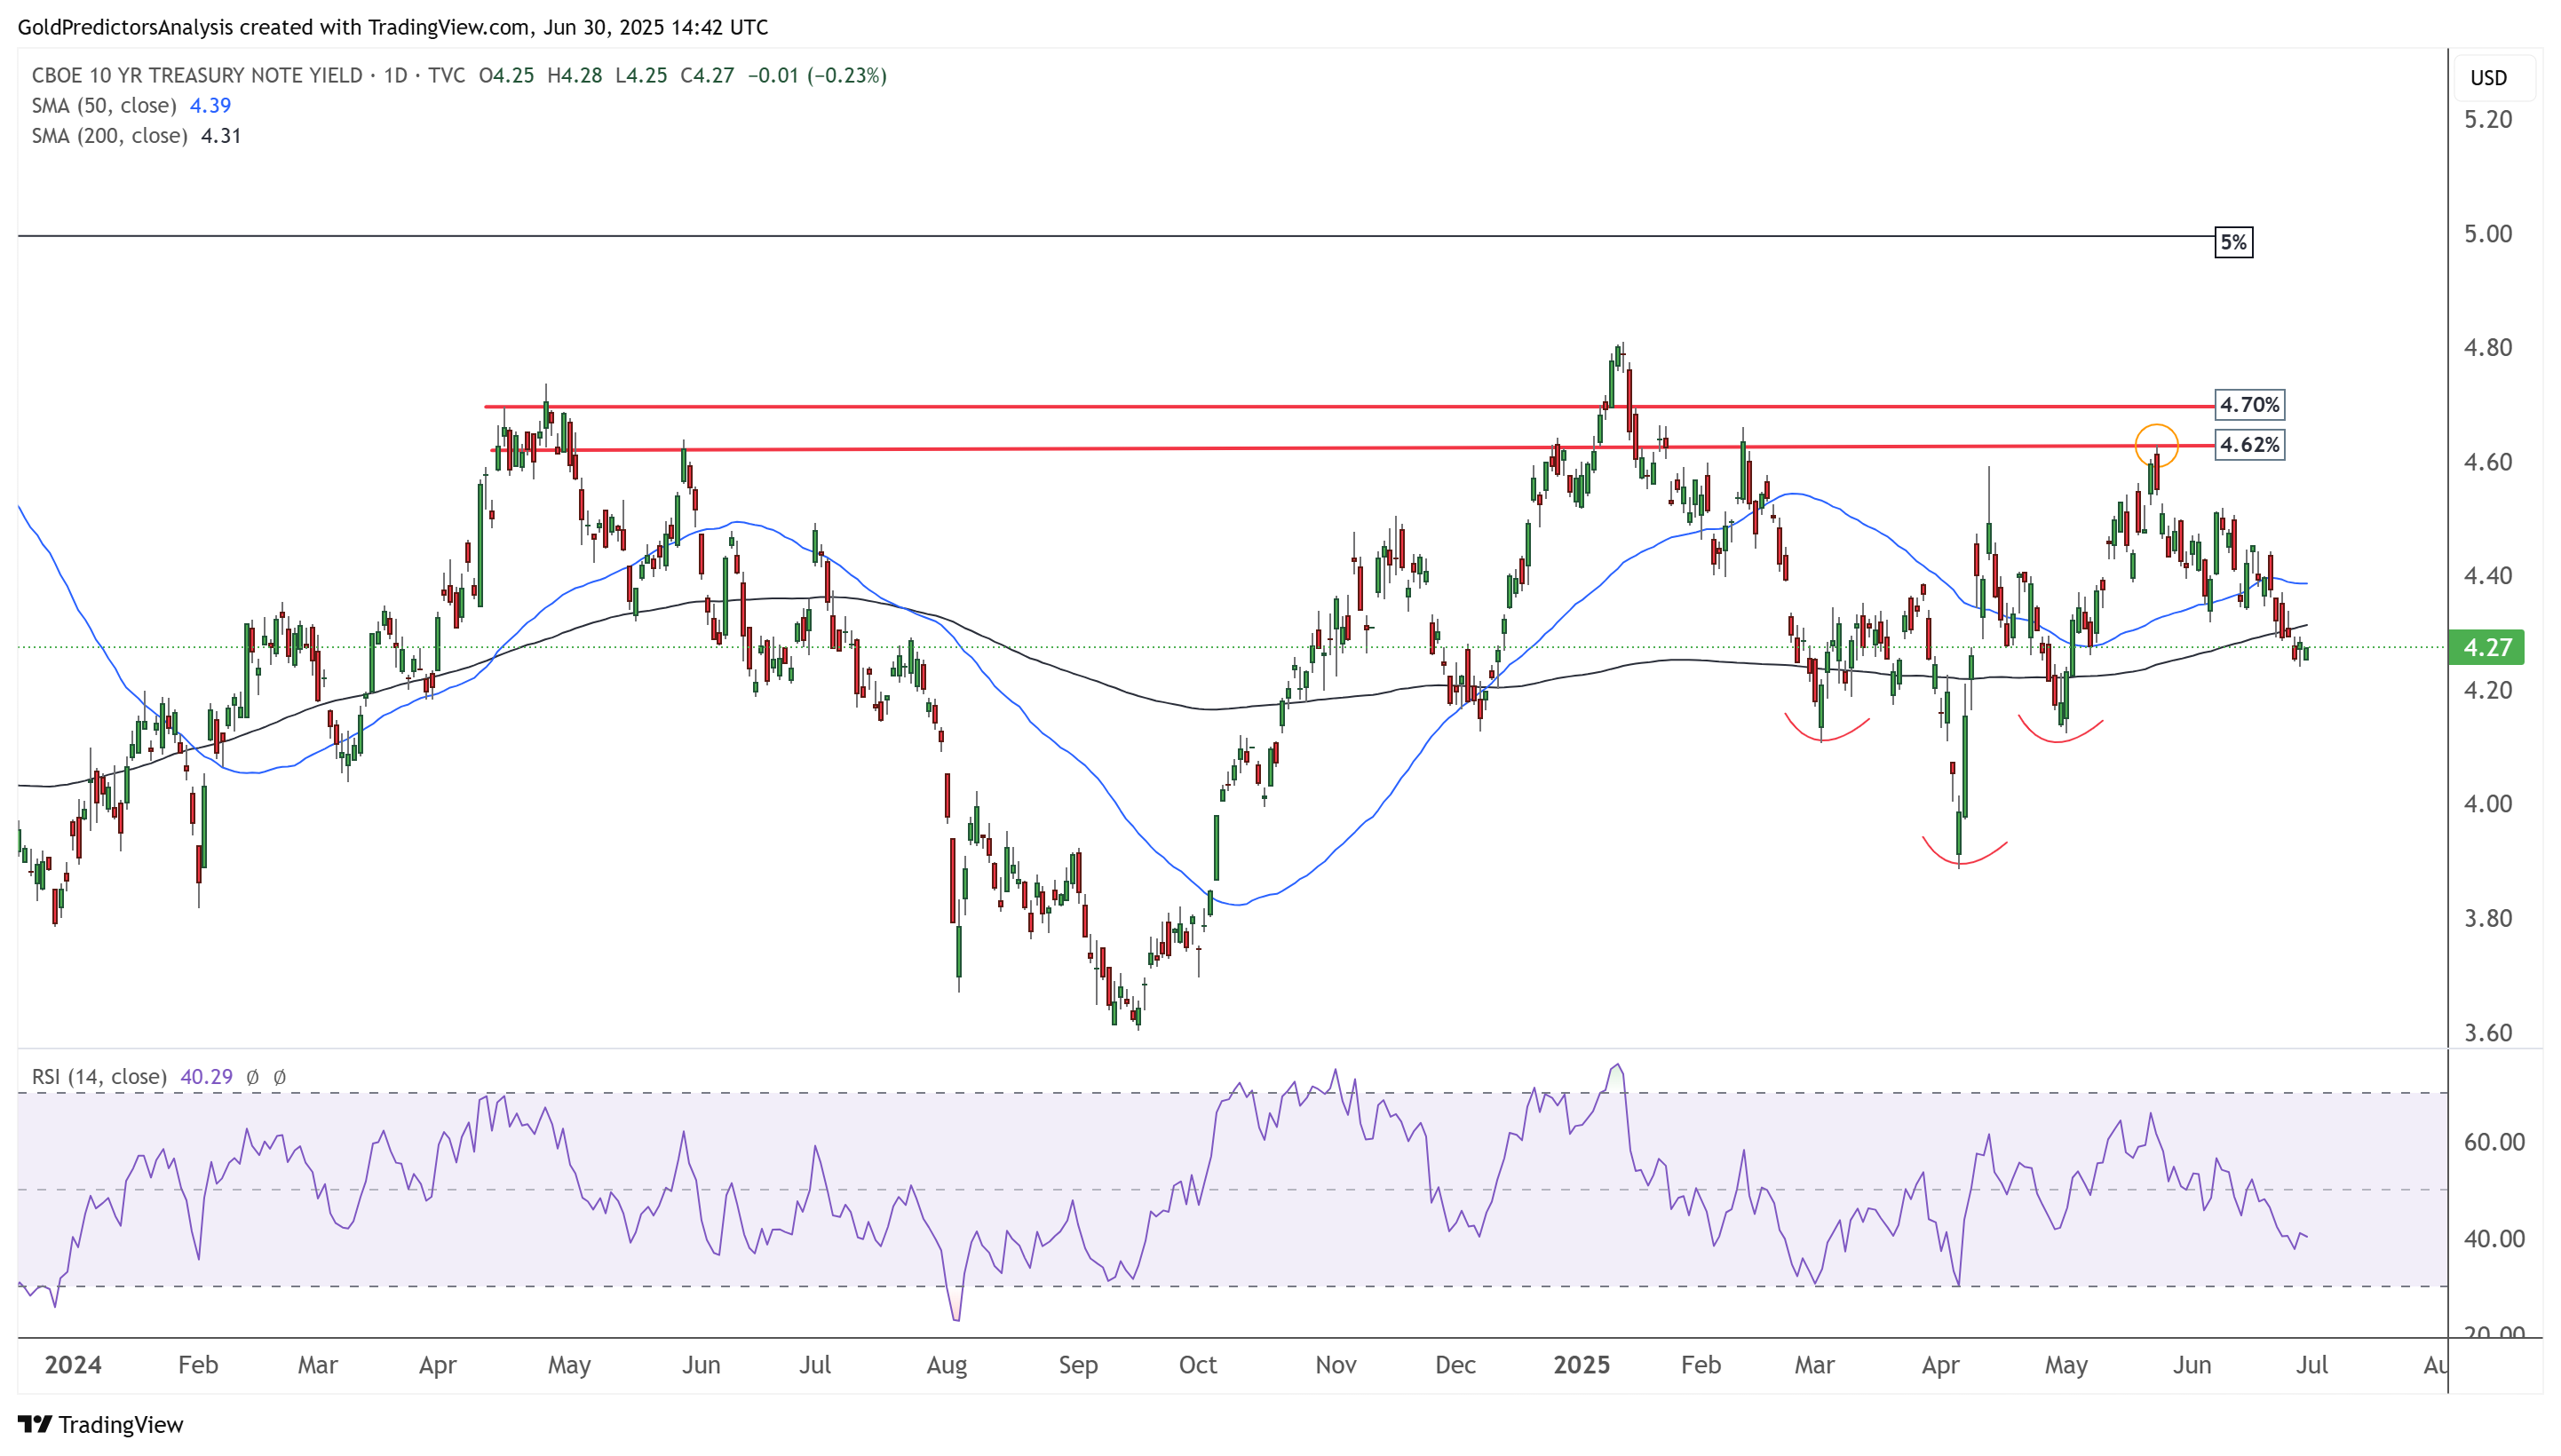
Meanwhile, 10-year Treasury yields declined to 4.25%, supporting risk assets and maintaining strong liquidity. Despite this, the broad Dow Jones US Index still lags behind the Dow Jones World-x-US Index, reflecting global strength outside the US.
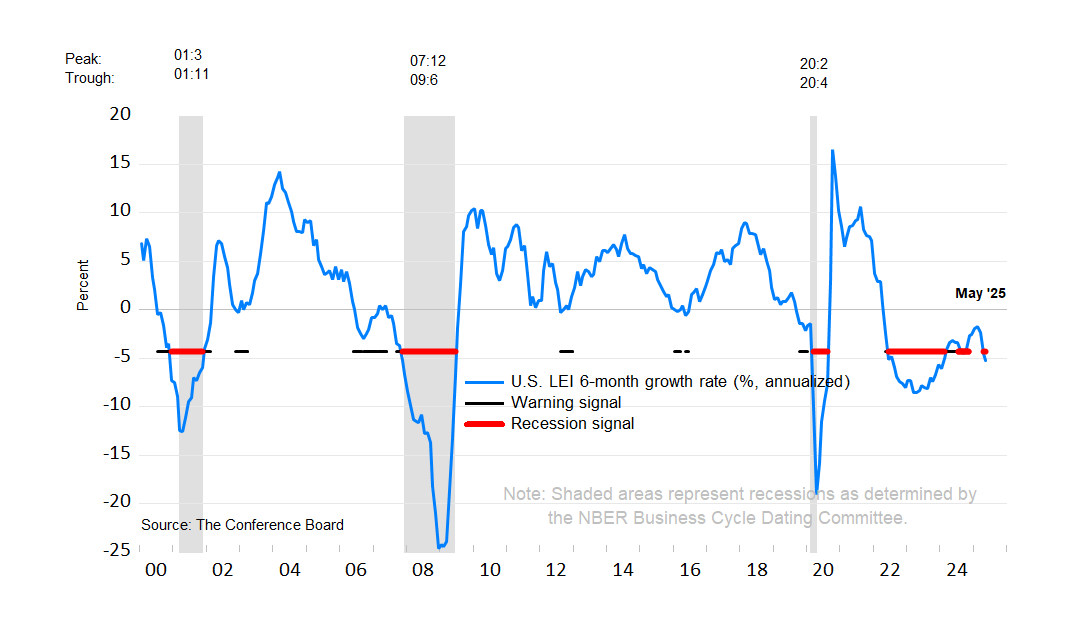
On the other hand, the economic data presents a different picture. The Conference Board’s Leading Economic Index (LEI) dropped to 99.0 in May. The chart below shows that the six-month growth rate fell to -5.4%, well below the -4.1% recession signal. Over 50% of LEI components show negative growth, confirming the warning.
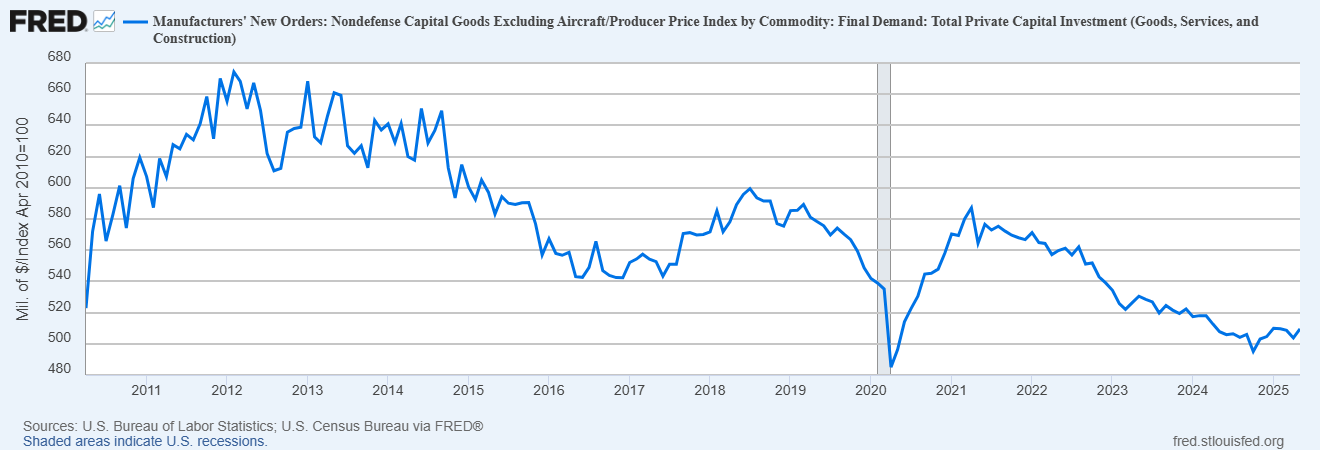
Moreover, the new orders for capital and consumer goods, adjusted for inflation, remain in a steep downtrend. These figures suggest that a recession risk persists despite strong market performance.
S&P 500 Breaks Record Highs After Retest of Key Support Zone
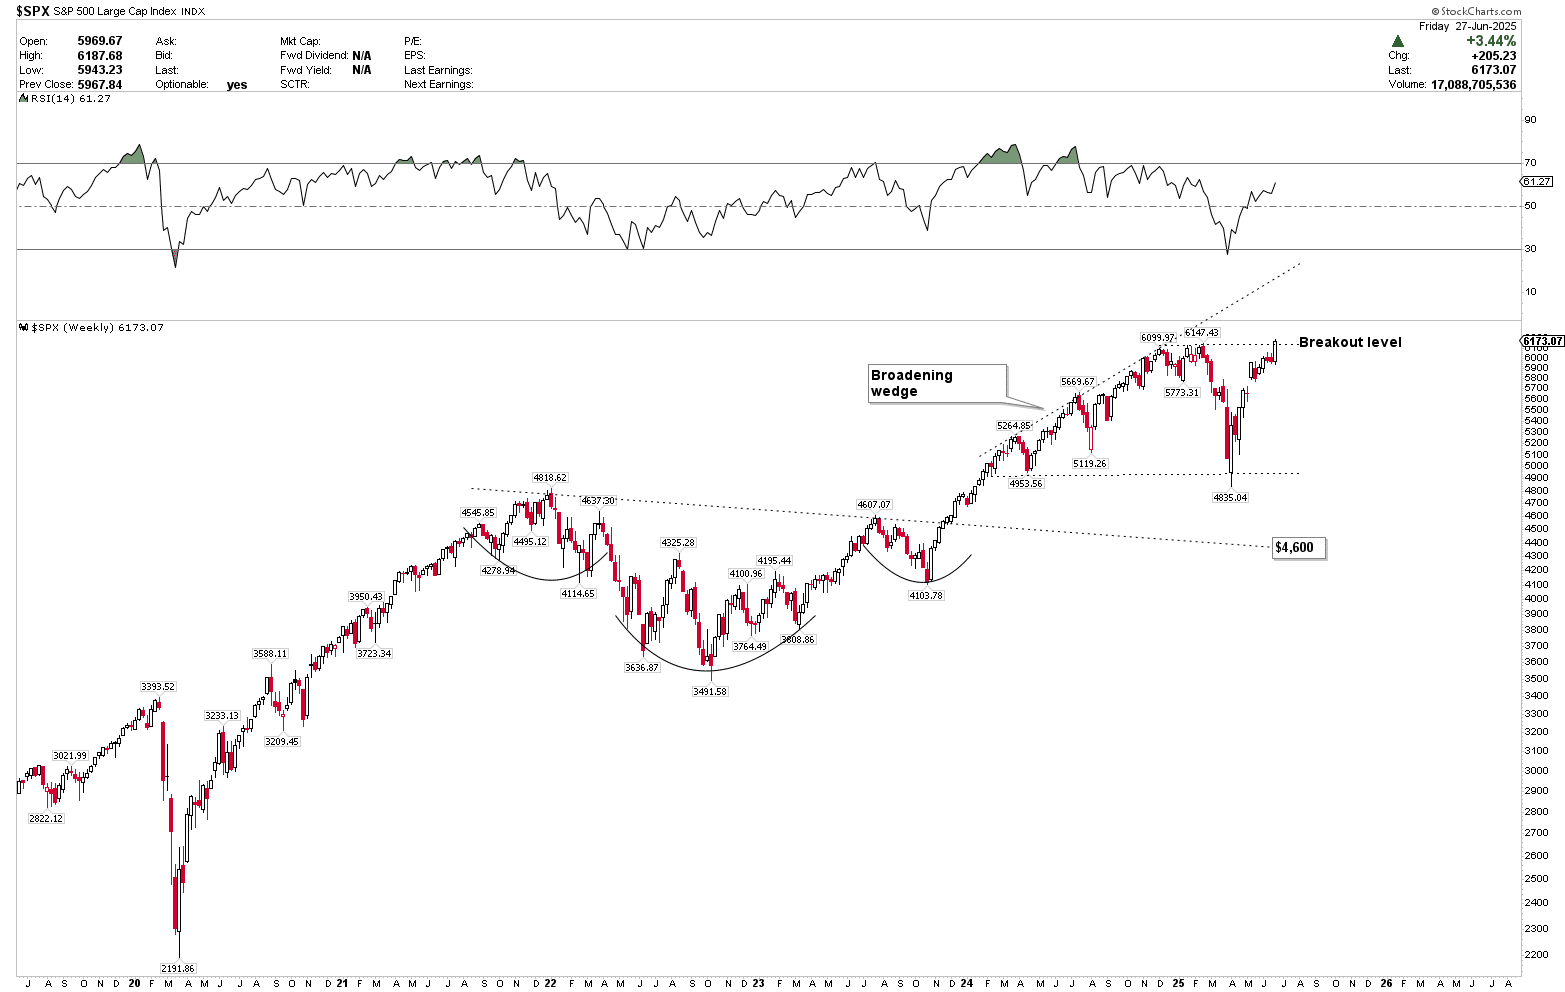
The weekly chart for the S&P 500 shows that the index has broken record levels. This breakout occurred after the S&P 500 successfully retested the previous breakout near the 4,600 region, indicating the potential for continued upward movement.
The emergence of ascending broadening after the formation of an inverted head and shoulder indicates strong volatility, which may take the index to much higher levels. Moreover, the RSI on the weekly chart indicates continued upward momentum despite the recession risks.
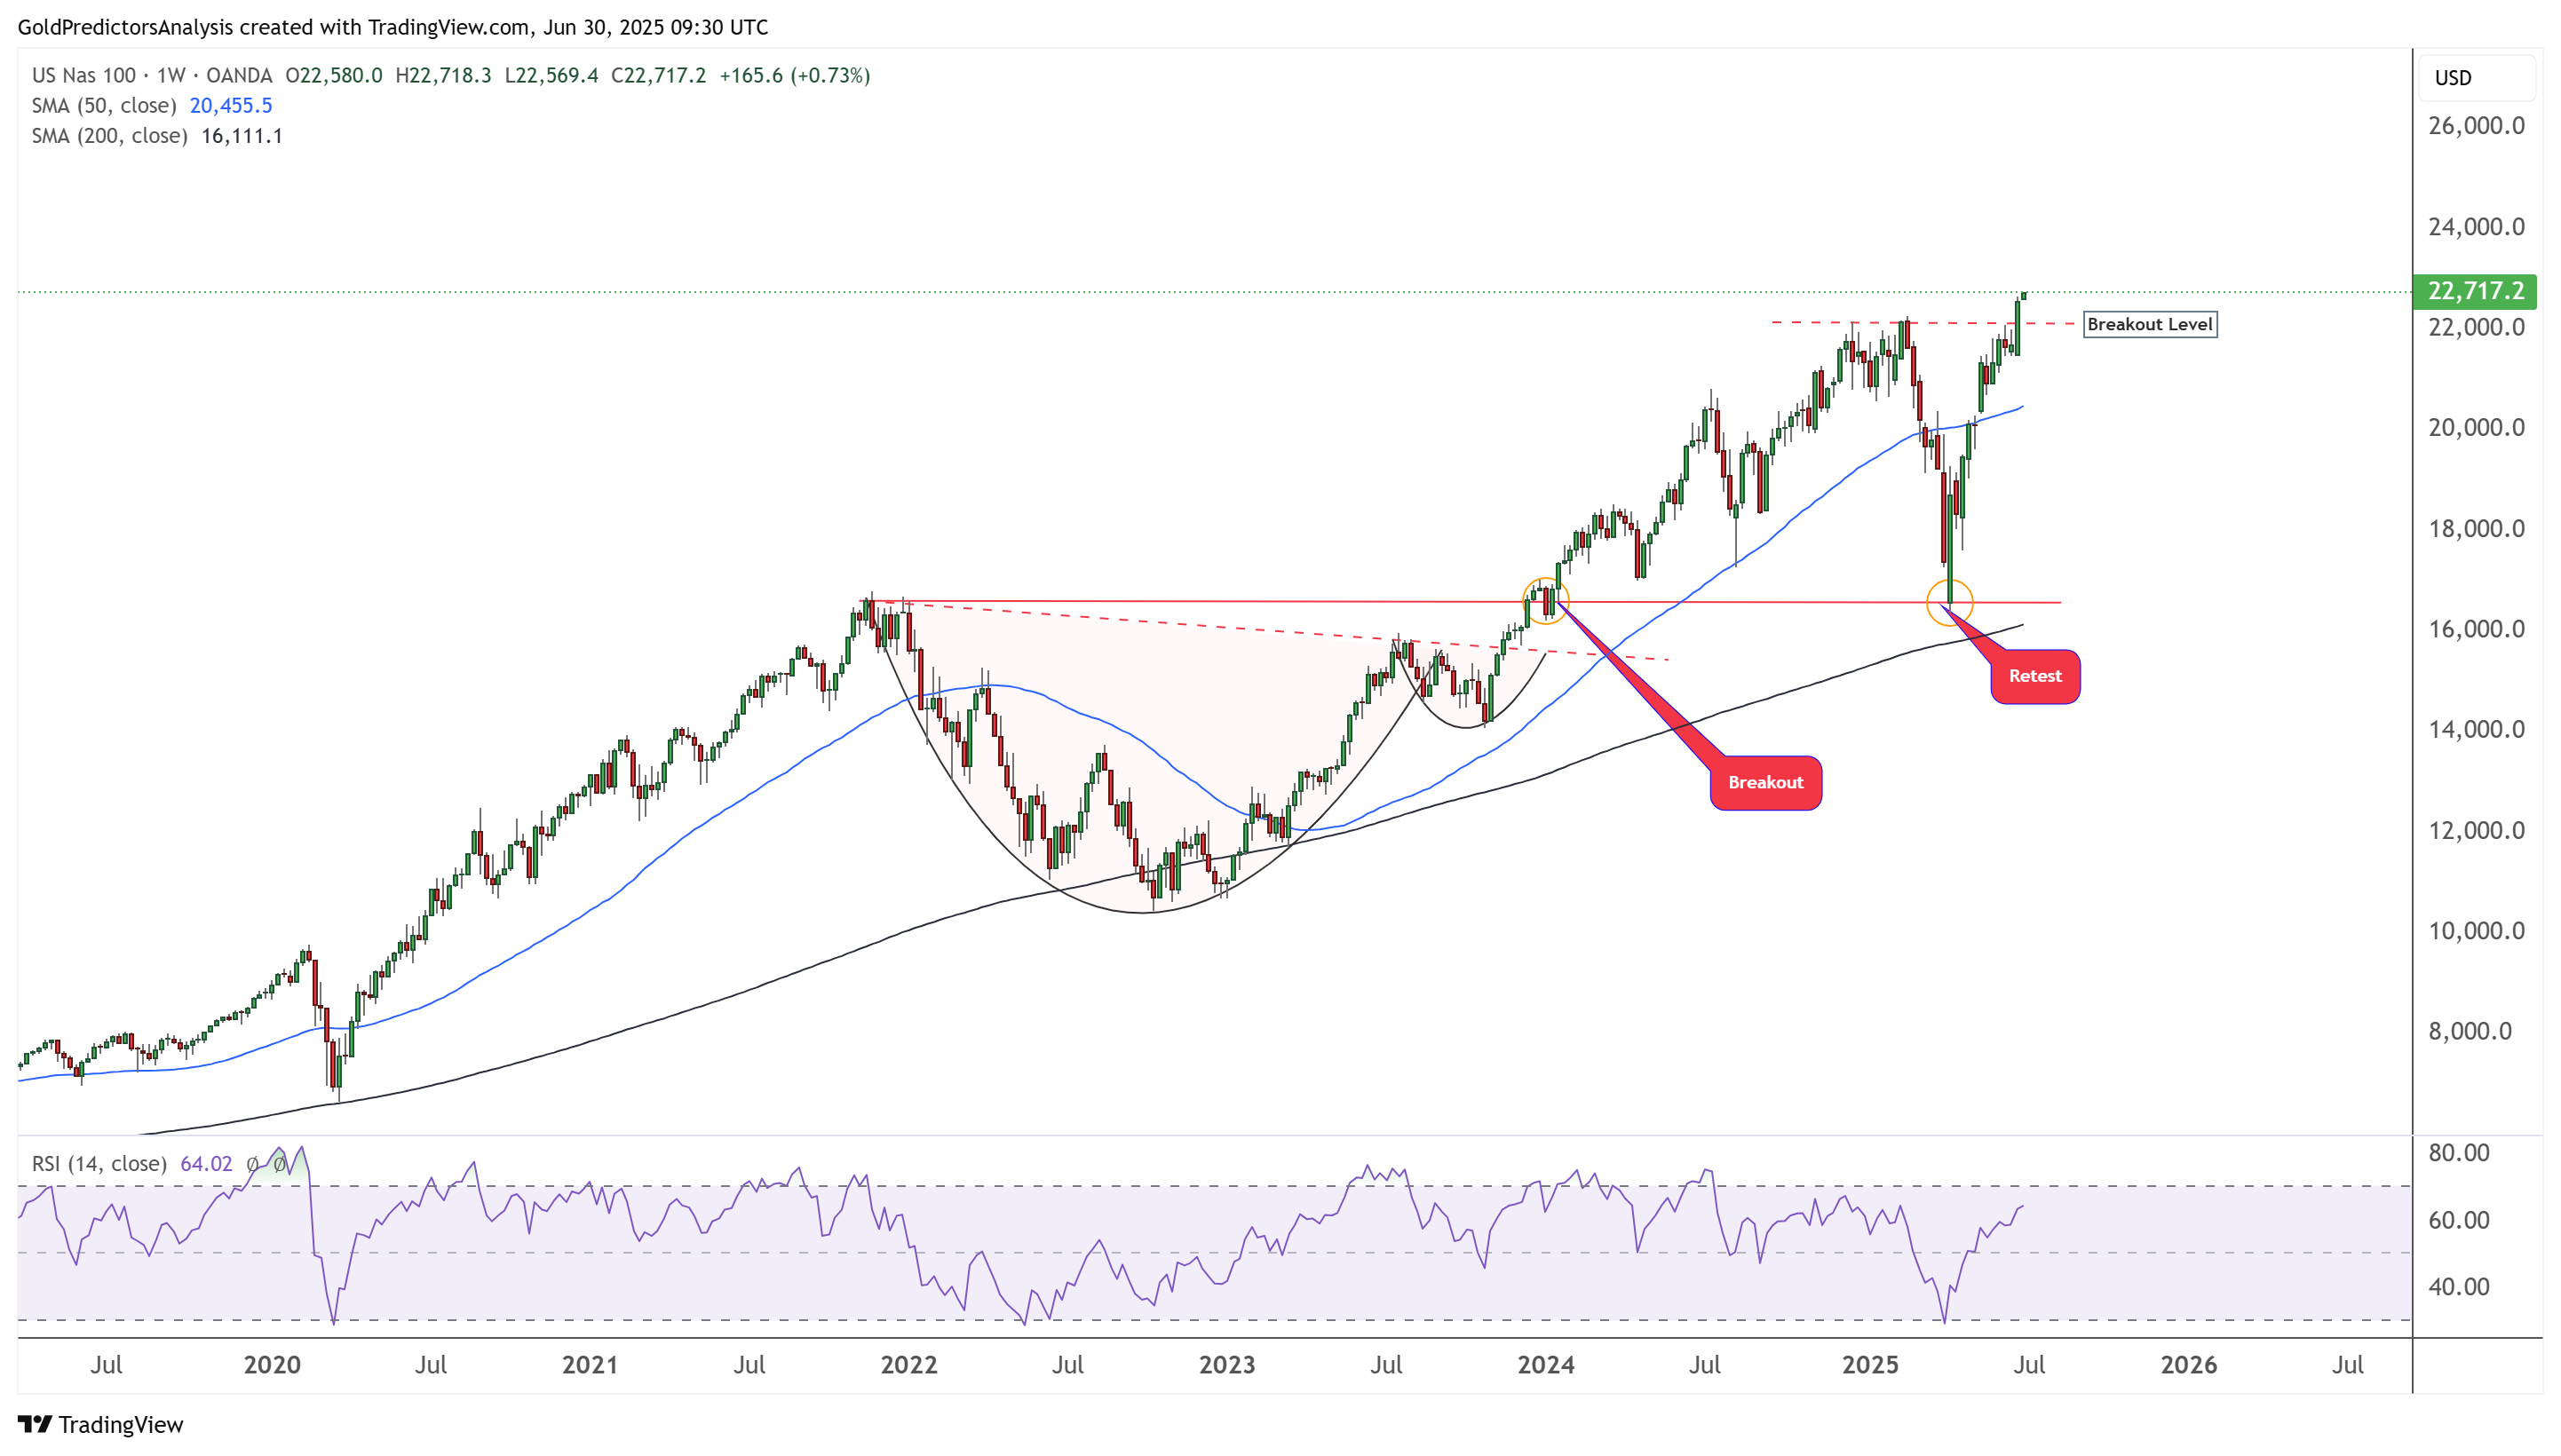
Nasdaq Surges Higher with Strong Technical Breakout and Bullish Momentum
The weekly chart for the Nasdaq 100 shows that the index has broken record levels and continues to trade higher. This breakout followed a successful retest of the 16,000 support zone, suggesting the potential for further upside.
The emergence of a cup and handle pattern before the breakout and subsequent retest signals strong bullish momentum in the Nasdaq. Moreover, the RSI has broken through the mid-level, indicating continued upward momentum in the Nasdaq 100.
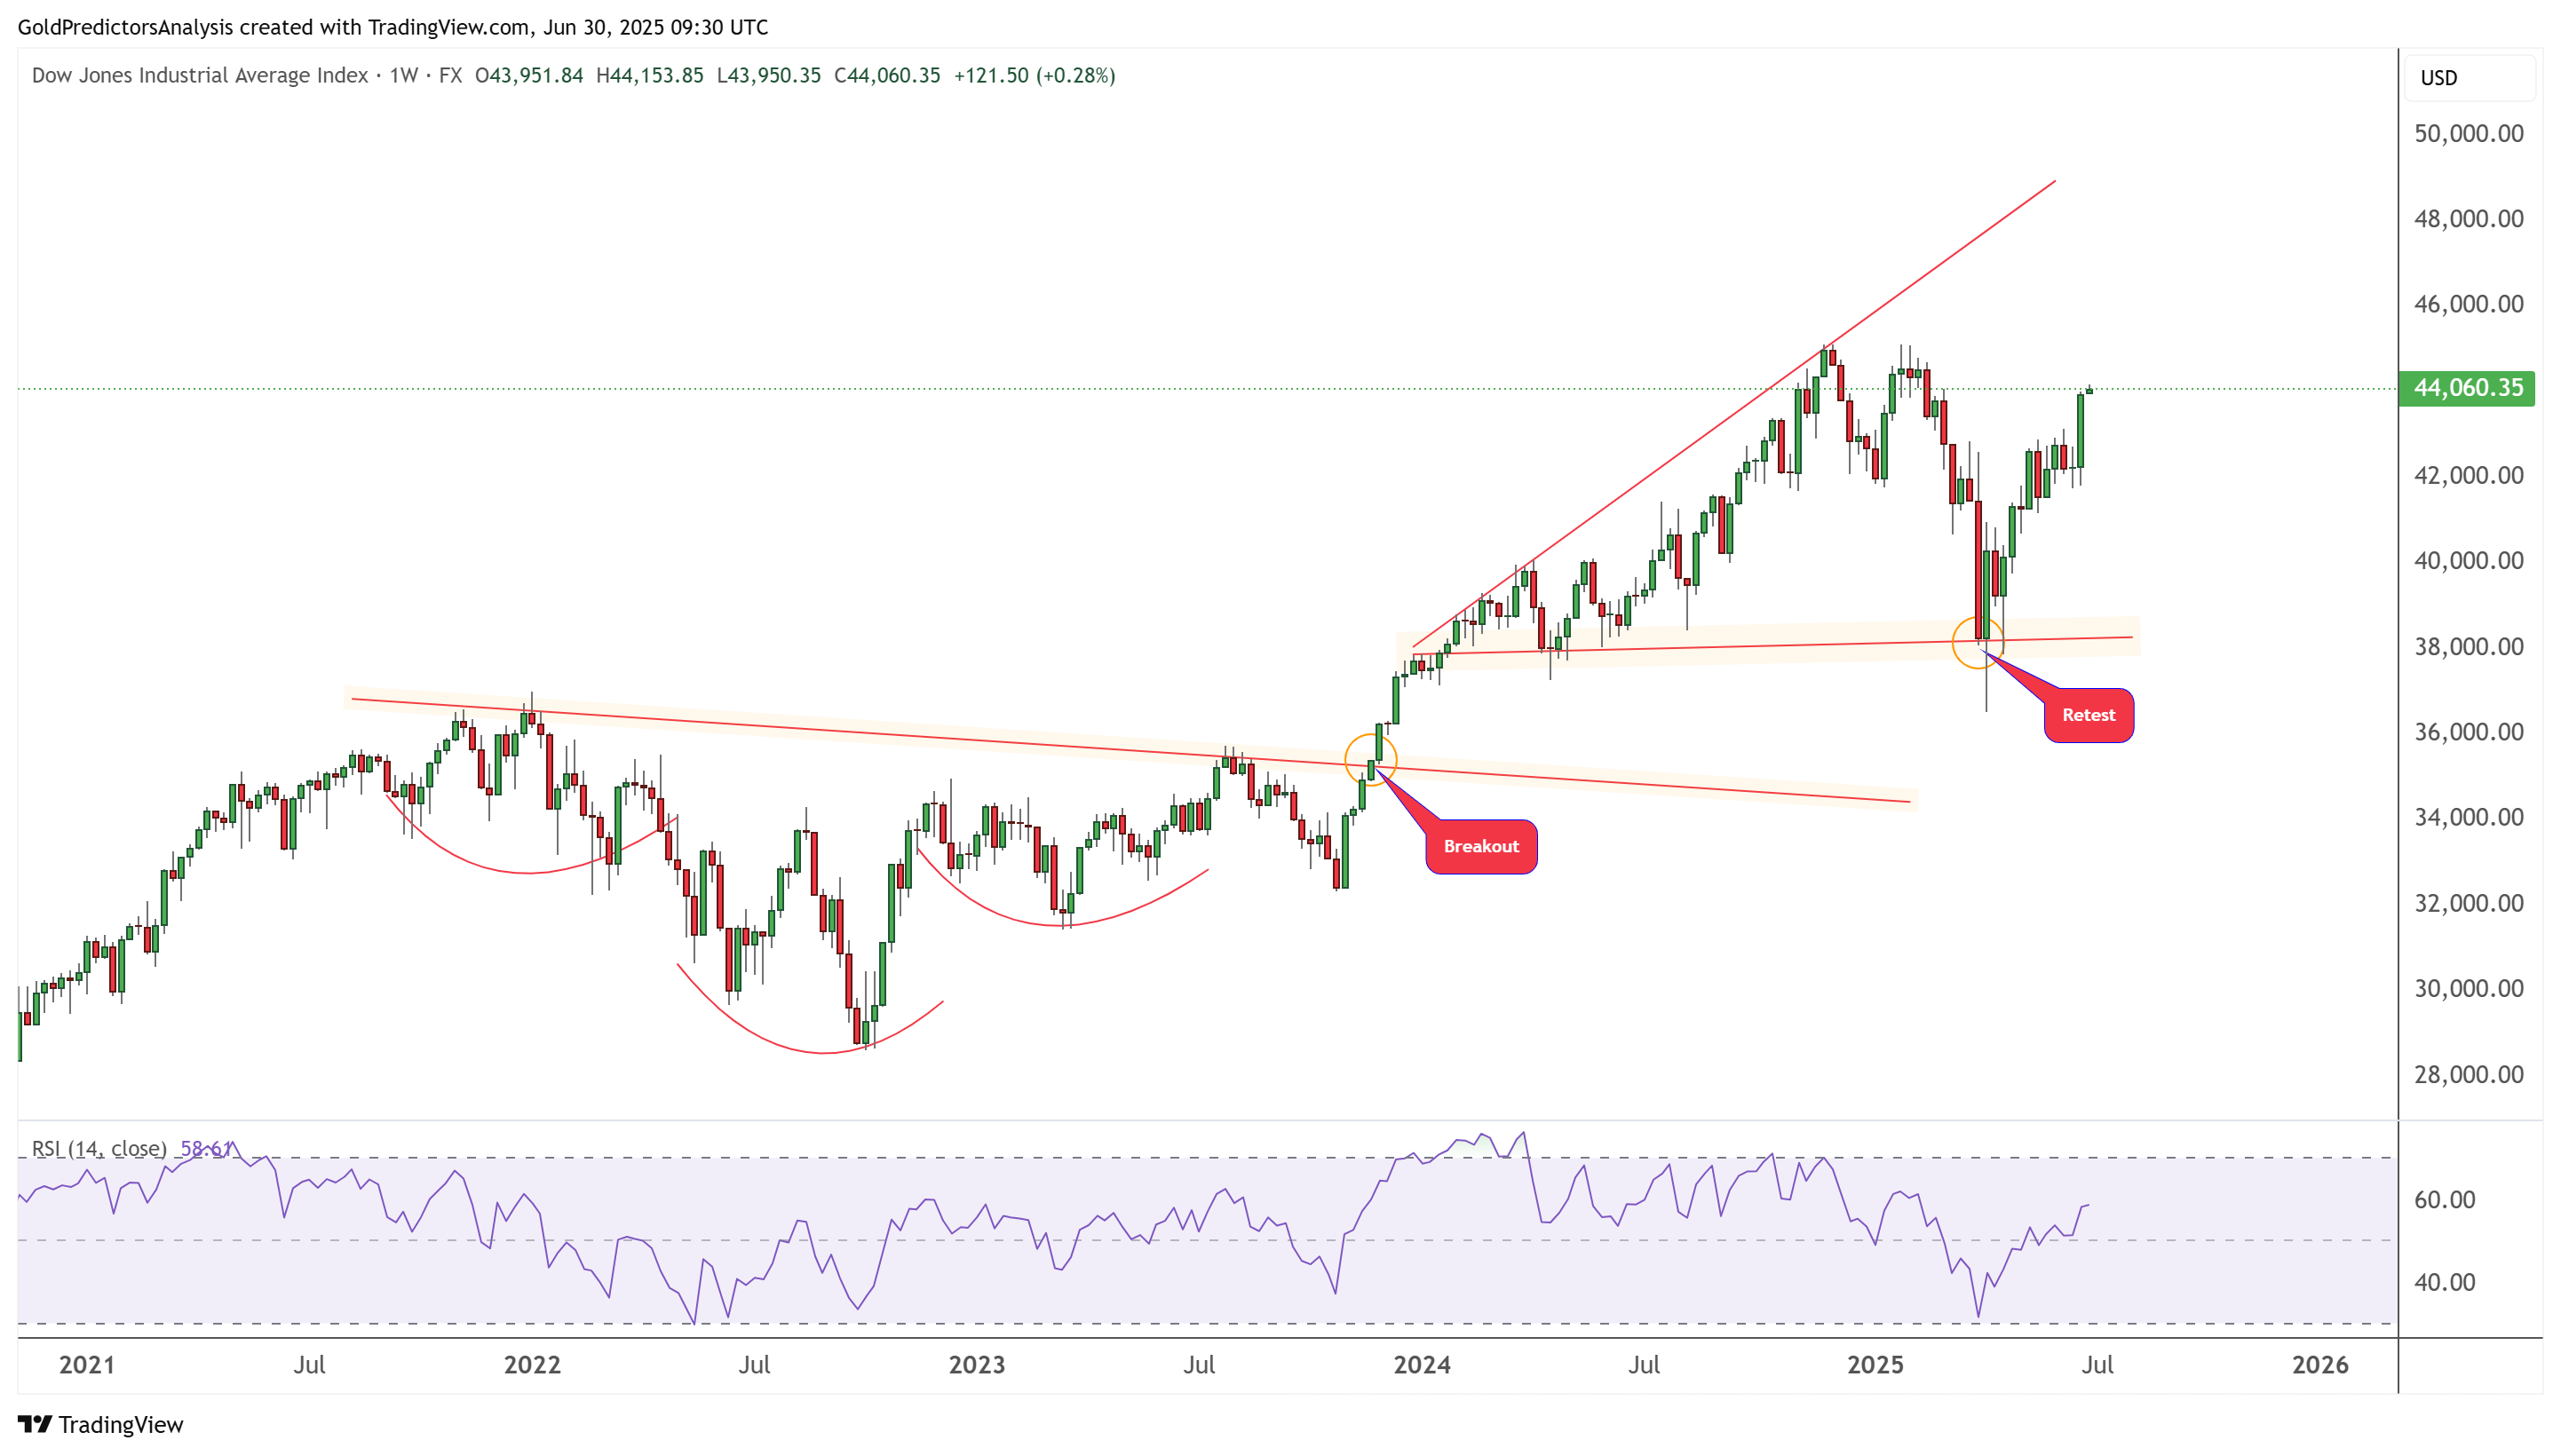
Dow Jones Lags Behind but Shows Signs of a Potential Breakout
Despite the breakouts in the Nasdaq and S&P 500, the Dow Jones 30 has failed to break record levels. It continues to show strong volatility within an ascending broadening wedge pattern.
However, the bullish formation at the bottom near the 36,500 support level suggests that the Dow may also break to new highs, which would further strengthen the bullish momentum across major indices. The strong weekly candle for the Dow Jones from last week highlights ongoing bullish momentum.
US Dollar Index Approaches Critical Support as Bearish Pressure Builds
The monthly chart for the US Dollar Index shows that the index is approaching long-term support near 96, defined by the ascending channel. A breakdown below this level is likely and could trigger a move toward the 90 area as the next significant long-term support. The monthly candles indicate sustained bearish pressure, suggesting the downtrend may continue.

About the Author
Bob MasonChief Crypto Boss
123456789 30 He has written extensively for a broader audience and his current focus is on developments relating to the financial markets including, but not limited to currencies, commodities, alternative asset classes, and global equities.


Advertisement