
Advertisement
Advertisement
Natural Gas and Oil Forecast: Crude Inventories Drop 2.8M Barrels, but GDP Contraction Looms
By:
WTI crude dips near $60 as OPEC+ signals output boost; US GDP shrinkage tempers demand outlook while natural gas tightens around $3.52–$3.70.

Market Overview
WTI crude futures hovered near $60.62 per barrel, facing a second consecutive weekly loss as traders digested mixed market signals. Geopolitical tensions added to the cautious sentiment, overshadowing the upcoming OPEC+ meeting where Kazakhstan hinted at a July production increase of 400,000–600,000 barrels per day.
Revised U.S. GDP data showing a 0.2% Q1 contraction fueled demand concerns. However, a surprising 2.8 million-barrel drop in U.S. crude inventories offered some relief, reflecting steady seasonal demand. Despite a temporary lift from a U.S. court ruling on tariffs, supply and demand imbalances remain the market’s focal point.
Natural Gas Price Forecast
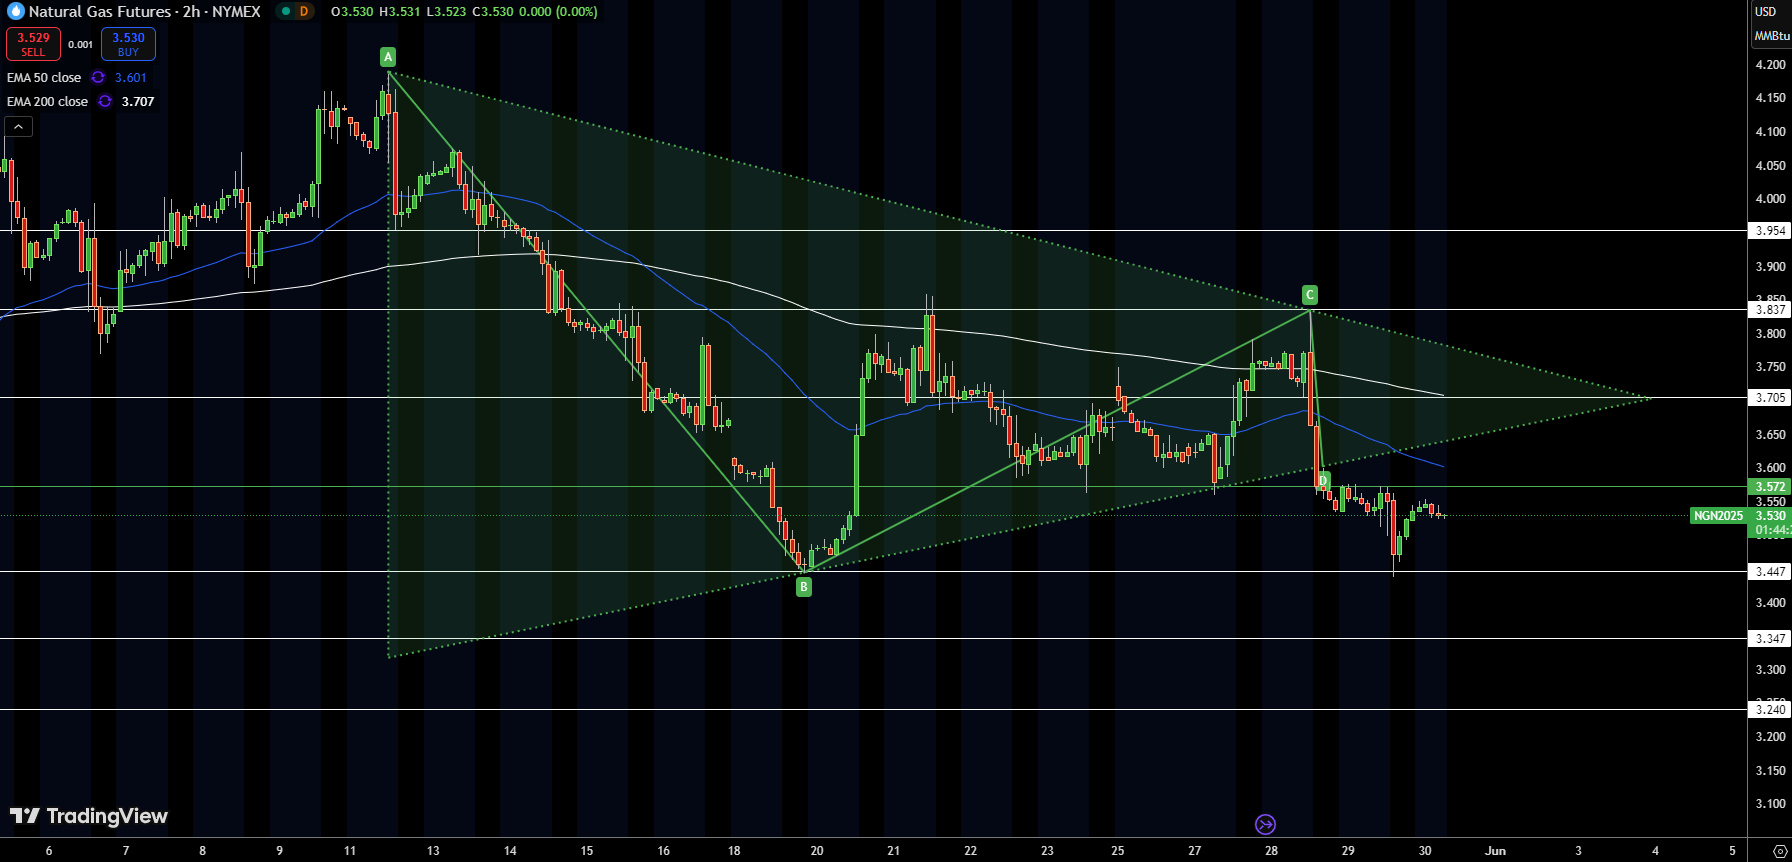
Natural gas futures are hovering around $3.53, facing a tight squeeze between resistance at $3.70 and support near $3.52. Price action has been coiling into a symmetrical triangle, marked by trendlines converging from $3.95 on the high side and $3.24 on the low.
The 50-EMA at $3.60 and the 200-EMA at $3.71 have been acting as dynamic resistance levels. Recent candlesticks show lower highs and a narrowing range, reflecting indecision.
If the $3.52 support cracks, we could see a swift drop toward $3.44 or even $3.35. Conversely, a breakout above $3.70 might open the door to $3.83 and higher.
WTI Oil Price Forecast
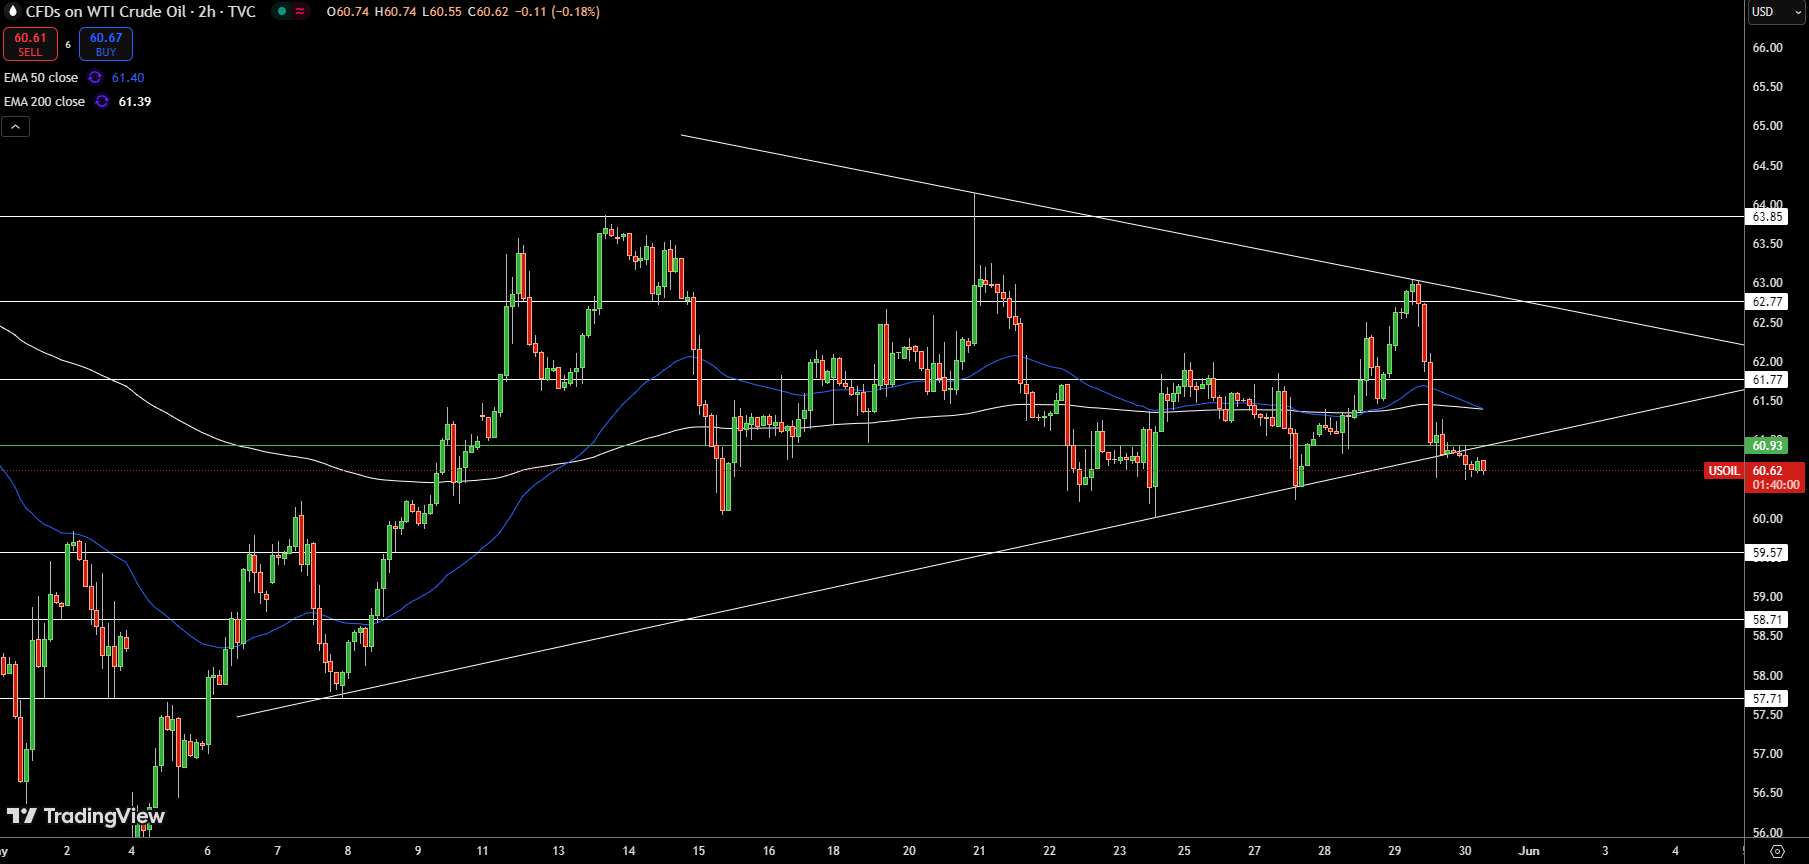
WTI crude is hovering at $60.62, pressing against a key wedge support that’s held since mid-May. The price is below both the 50-EMA ($61.40) and the 200-EMA ($61.39), with the immediate resistance at $61.77 and a tougher ceiling at $62.77.
Price action has struggled to hold gains, marked by small-bodied candles near resistance, indicating fading buying interest. If the $60.55 level breaks, it opens the path toward $59.57 and $58.71. A clean push above $61.77 with momentum might shift the bias to the upside.
For now, the structure favors a potential move lower unless buyers step in decisively above $61.77, giving us a classic wedge pattern play with clear risk levels.
Brent Oil Price Forecast
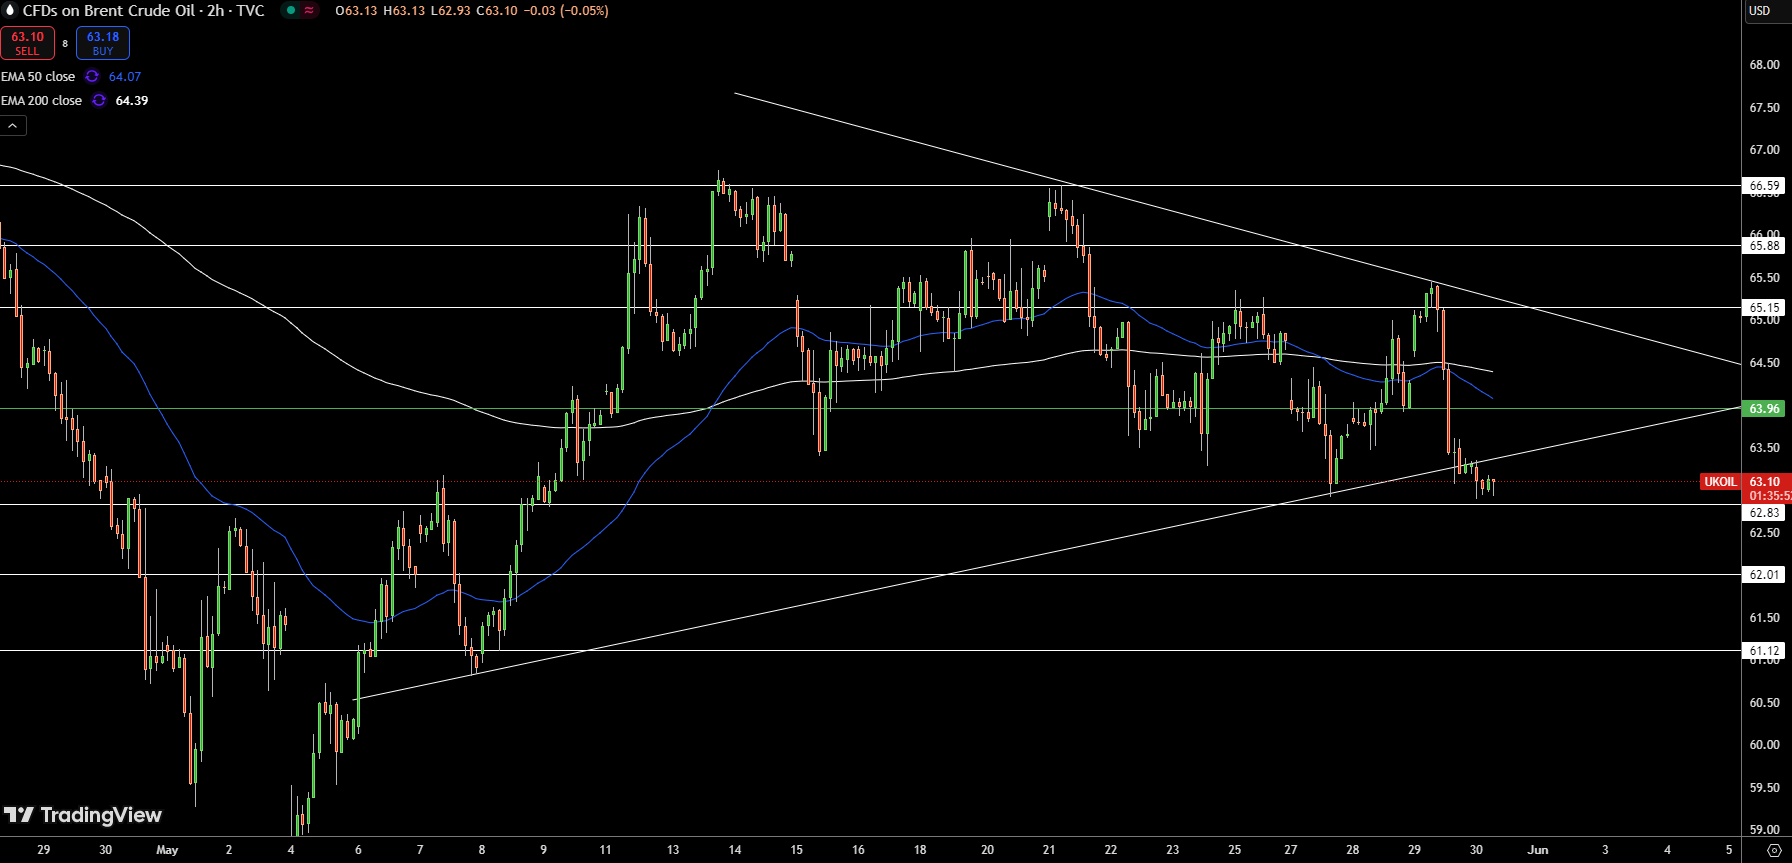
Brent crude is trading near $63.10, clinging to key support just above $62.83. Price action shows a descending triangle pattern with the upper resistance at $65.15 and $65.88, while the 50-EMA at $64.07 and 200-EMA at $64.39 weigh overhead.
The recent candlestick patterns display weak bullish attempts—spinning tops and small bodies—failing to reclaim $63.96. If $62.83 gives way, we could see a slide toward $62.01 or $61.12.
However, a solid push above $64.07, paired with a breakout above the trendline resistance, could reignite the bullish spark and send prices toward $65.15. For now, caution prevails, with sellers holding the upper hand until buyers reclaim territory above $64.07.
About the Author
Bob MasonChief Crypto Boss
123456789 30 He has written extensively for a broader audience and his current focus is on developments relating to the financial markets including, but not limited to currencies, commodities, alternative asset classes, and global equities.


Advertisement