
Advertisement
Advertisement
Natural Gas and Oil Forecast: Energy Prices Steady Amid U.S. Jobs Strength
By:
Key Points:
- WTI crude steadies near $64.50 as trade optimism and U.S. job growth support demand sentiment amid rising global tensions.
- Natural gas holds above $3.70 support, with bullish momentum confirmed by higher lows and EMA crossovers on short-term charts.
- Brent crude pulls back from $66.61 high; fading volume and narrow candles hint at a short-term top unless buyers retake control.

Market Overview
WTI crude hovered near $64.50 per barrel on Monday, extending last week’s gains amid renewed optimism around global trade discussions and heightened geopolitical tensions.
Fresh diplomatic talks between major economies signaled potential relief from demand-side pressures, while a stronger-than-expected U.S. jobs report reinforced confidence in energy consumption.
Meanwhile, escalating conflicts in Eastern Europe raised concerns about further sanctions on key energy exporters, fueling fears of tighter global supply.
Natural gas prices also saw upward pressure as traders priced in geopolitical instability and supply disruption risks. The combined impact is keeping energy markets on edge, with volatility likely to persist.
Natural Gas Price Forecast
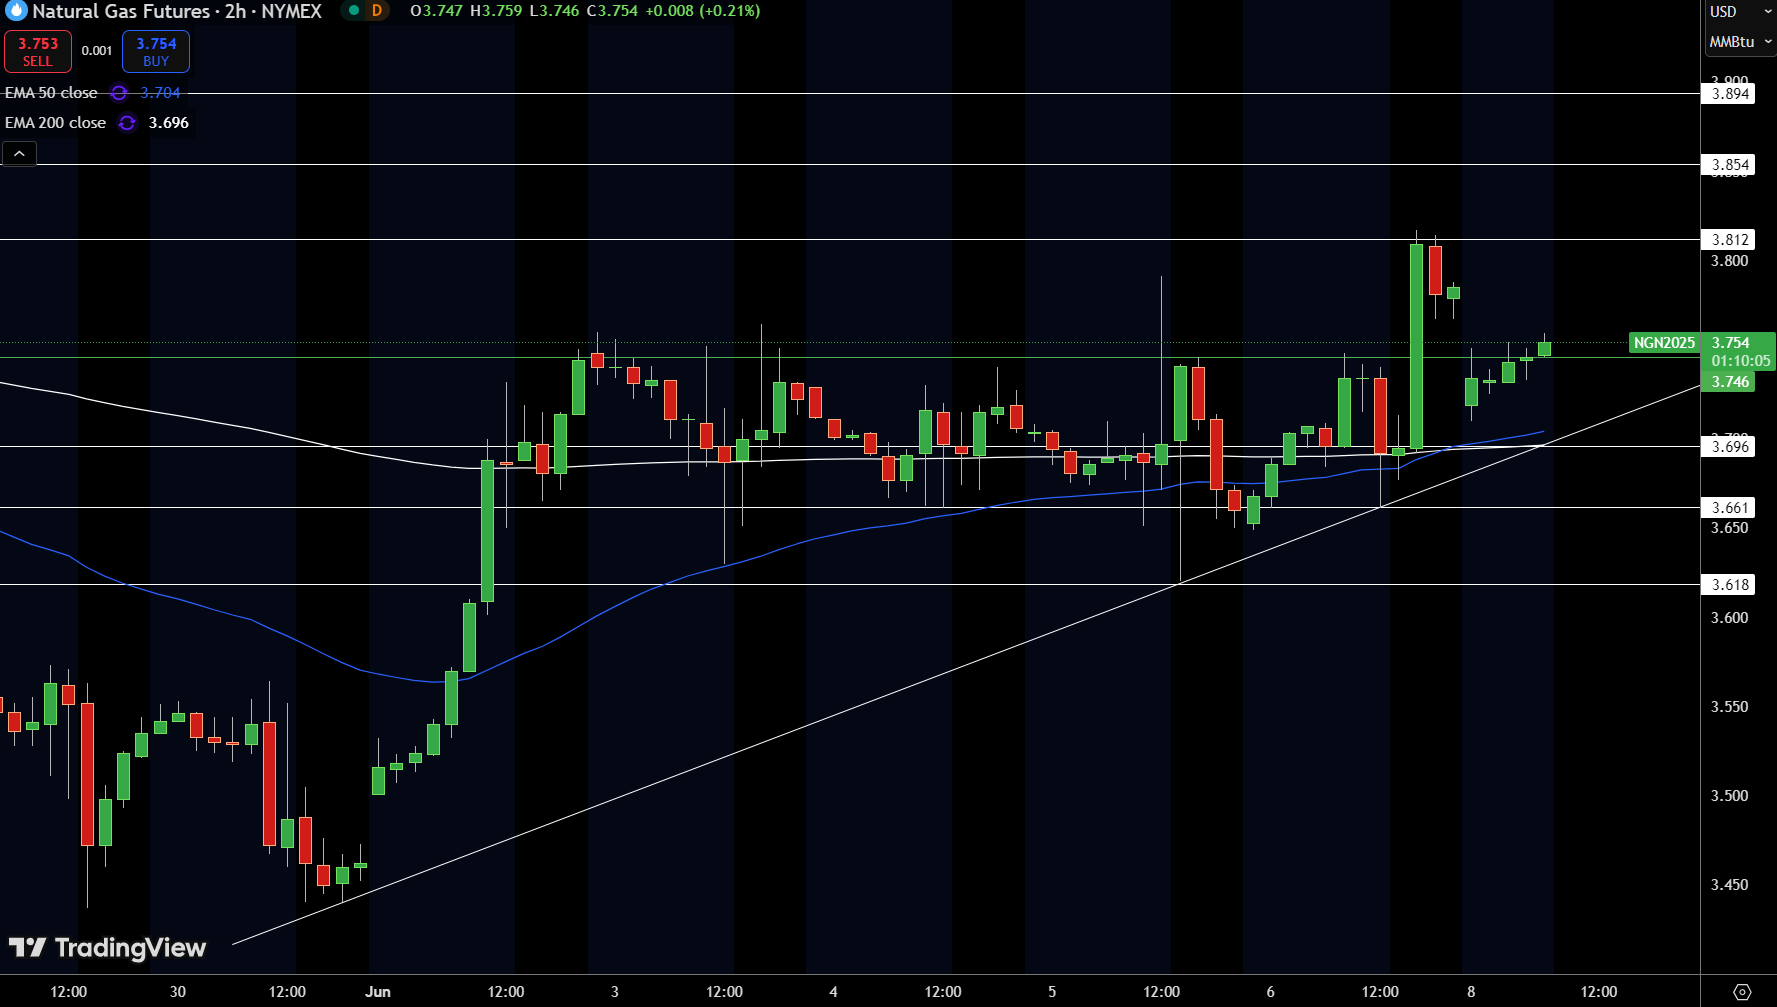
Natural gas futures are holding firm above the $3.70 support, currently trading near $3.754 after reclaiming both the 50 EMA ($3.704) and the 200 EMA ($3.696) on the 2-hour chart. Price action is respecting the ascending trendline from late May, with higher lows confirming underlying strength.
Buyers briefly tested resistance at $3.812 before pulling back, and the price now appears to be consolidating in a tight range. A sustained move above $3.812 could expose the $3.854 and $3.894 levels.
On the downside, if $3.70 fails to hold, a retest of $3.661 and $3.618 becomes likely. Bias remains bullish as long as the price stays above the rising trendline.
WTI Oil Price Forecast
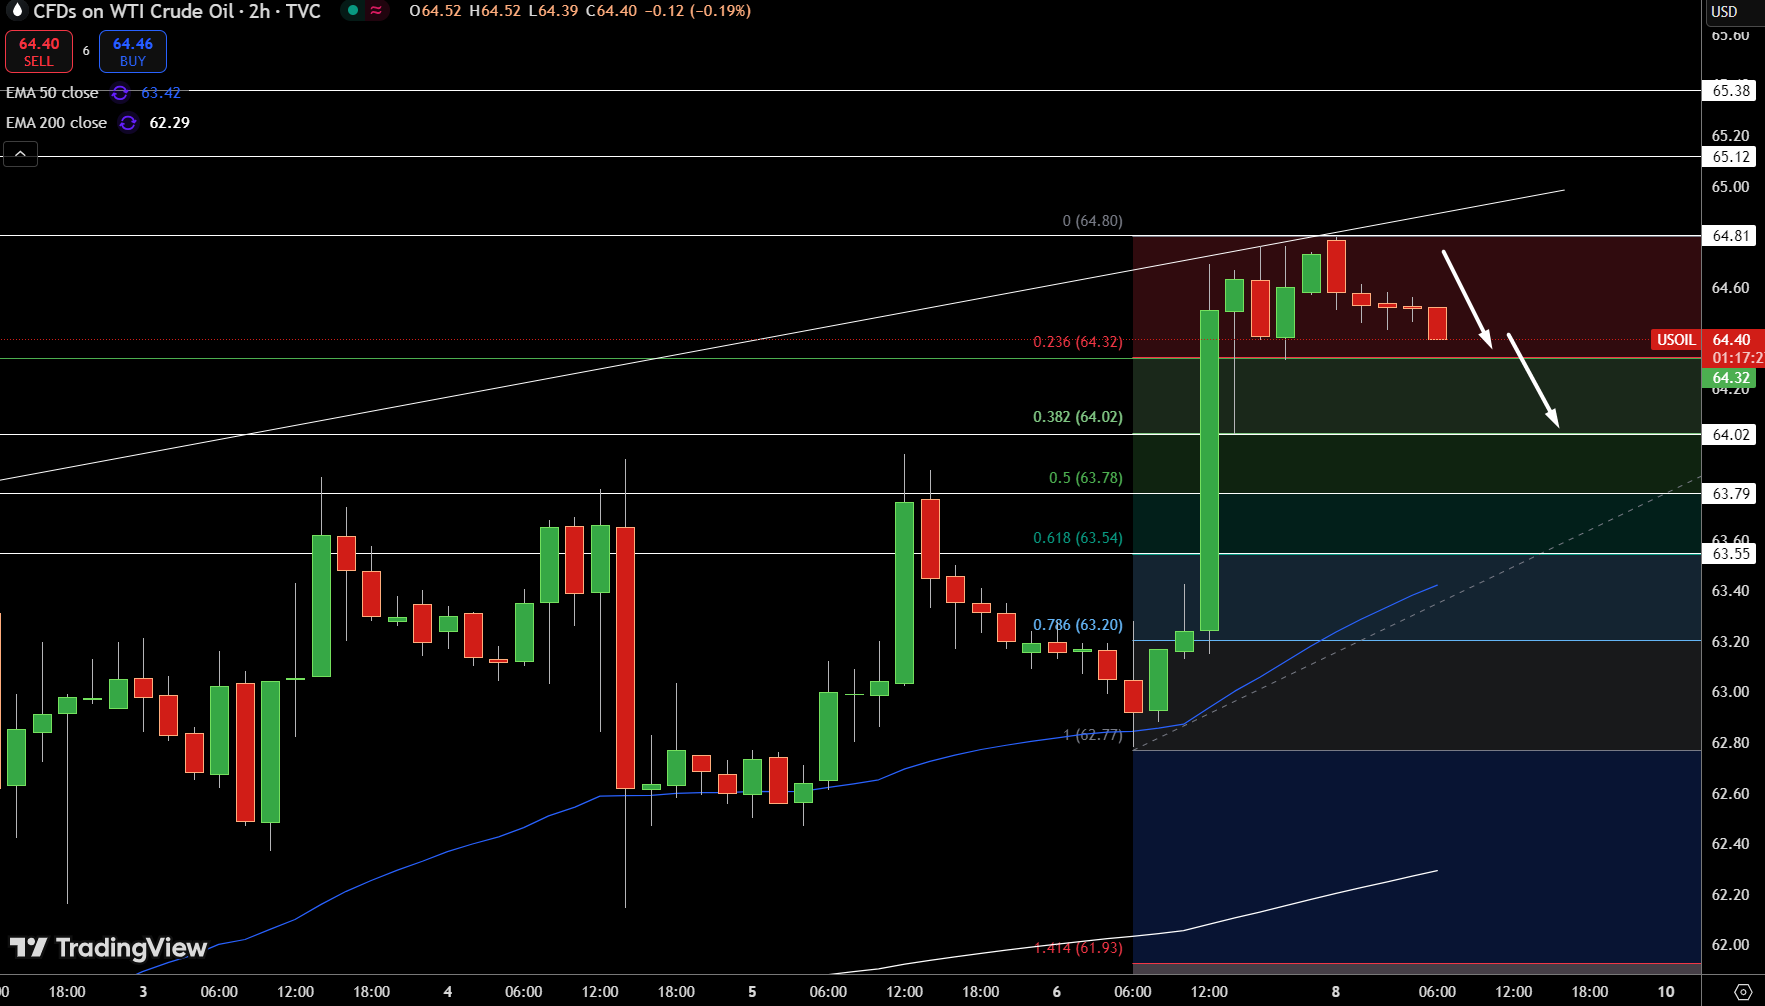
WTI crude oil is showing early signs of exhaustion after stalling at $64.80. Price is now pulling back below the 23.6% Fibonacci level at $64.32, with lower highs forming on the 2-hour chart. If sellers maintain pressure, the next support zones sit near $64.02 (38.2% Fib) and $63.78 (50% Fib).
A break below $63.54 could confirm deeper retracement toward the 200 EMA at $62.29. The candles are printing smaller bodies, hinting at slowing momentum, while both EMAs remain upward sloping.
For now, the short-term outlook leans bearish unless $64.80 is reclaimed with strength. Momentum favors intraday selling as long as the price remains under $64.32.
Brent Oil Price Forecast
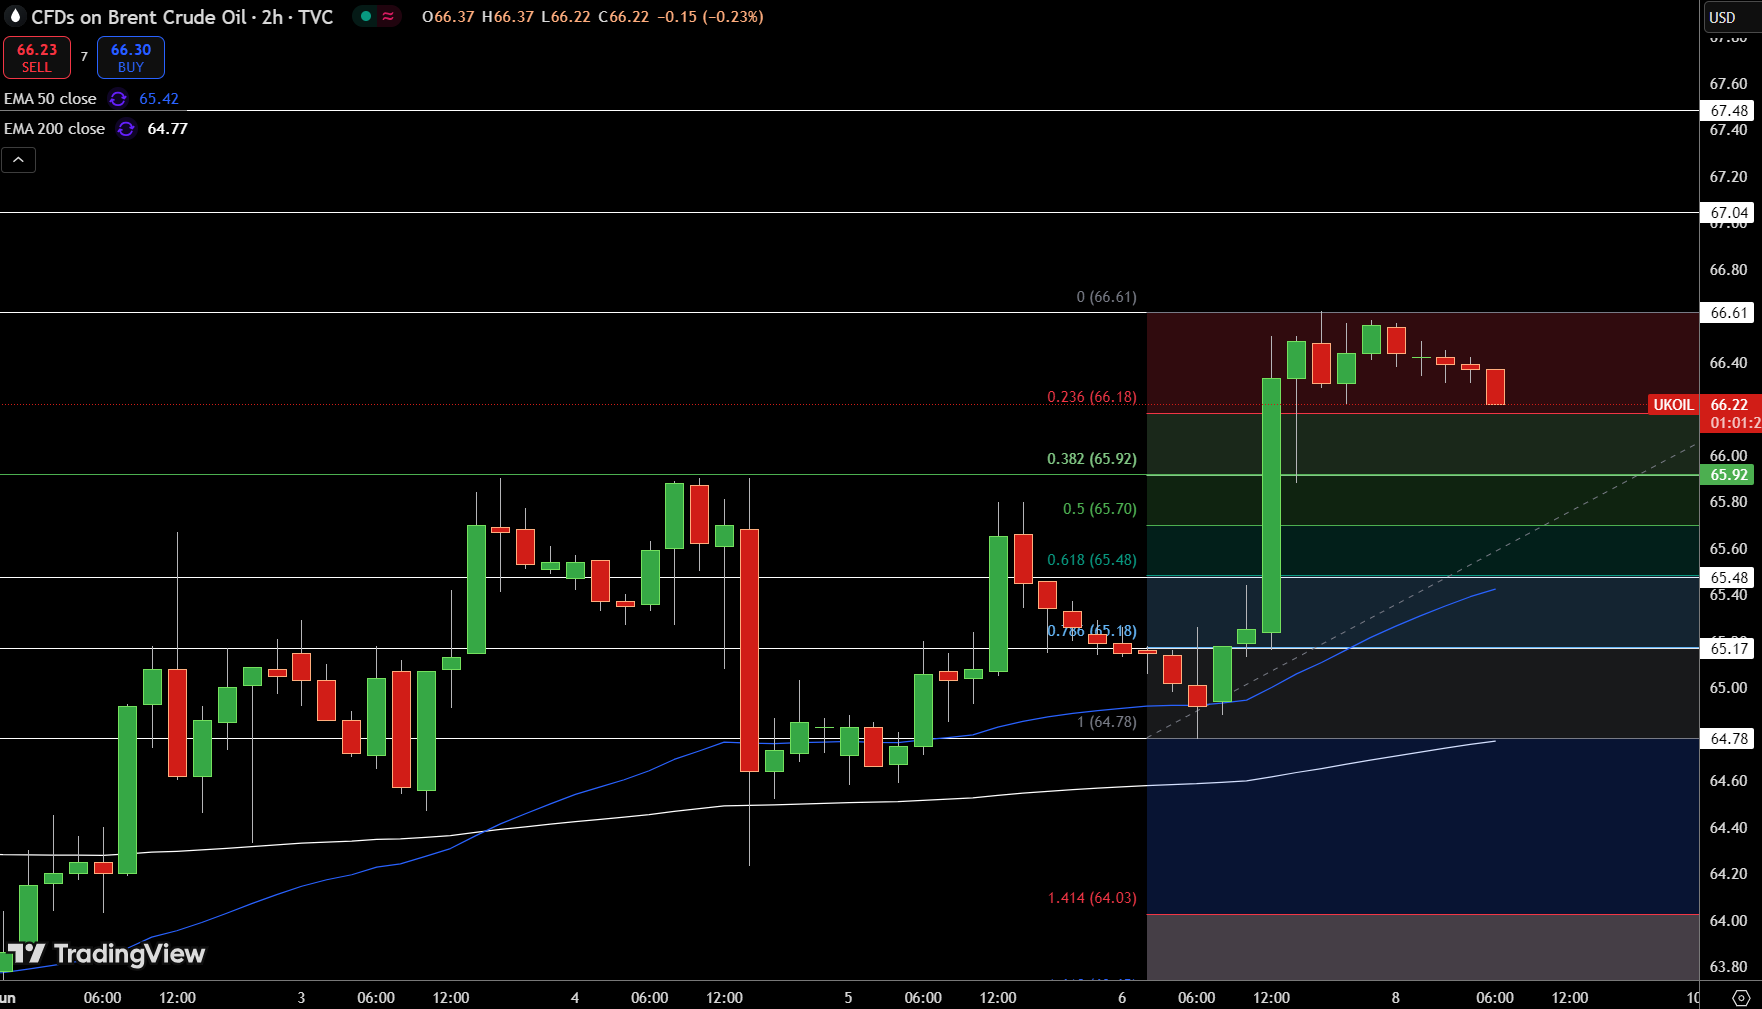
Brent crude oil is easing from the $66.61 high, now trading near $66.22 as early weakness emerges below the 23.6% Fibonacci level at $66.18. Price action on the 2-hour chart shows fading momentum after a substantial vertical spike, with candles narrowing and volume dropping.
The next key support level rests near $65.92 (38.2% Fibonacci retracement), followed by $65.70 and $65.48. Both the 50 EMA ($65.42) and 200 EMA ($64.77) continue to trend upward, reinforcing the underlying strength; however, short-term pullbacks remain likely unless $66.61 is reclaimed.
A drop below $65.92 may open the door to a deeper correction, potentially reaching $65.18 or lower.
About the Author
Bob MasonChief Crypto Boss
123456789 30 He has written extensively for a broader audience and his current focus is on developments relating to the financial markets including, but not limited to currencies, commodities, alternative asset classes, and global equities.


Advertisement