
Advertisement
Advertisement
Natural Gas and Oil Forecast: How Kurdistan Exports Impact Global Supply
By:
Key Points:
- Geopolitical tensions and Kurdistan exports are reshaping global natural gas and oil supply dynamics.
- Increased supply from Kurdistan could ease global constraints but adds volatility to crude oil prices.
- WTI Oil tests $70.10 pivot point, holding above this level keeps the outlook cautiously bullish.

Market Overview
Natural gas and oil prices are under pressure as geopolitical tensions continue to influence global energy markets. The prospect of resumed exports from Kurdistan’s oilfields has contributed to a downward trend, while ongoing diplomatic discussions aim to resolve broader international conflicts.
Market analysts suggest that increased supply from Kurdistan could ease global supply constraints, affecting crude prices. Additionally, sanctions impacting energy exports have disrupted supply flows, adding volatility to the market.
Investors remain focused on geopolitical developments, as potential resolutions could significantly impact energy prices and market dynamics in the short term. Geopolitical tensions are likely to keep energy markets volatile. Traders should monitor supply chain news and diplomatic talks for potential catalysts in price movement.
Natural Gas Price Forecast
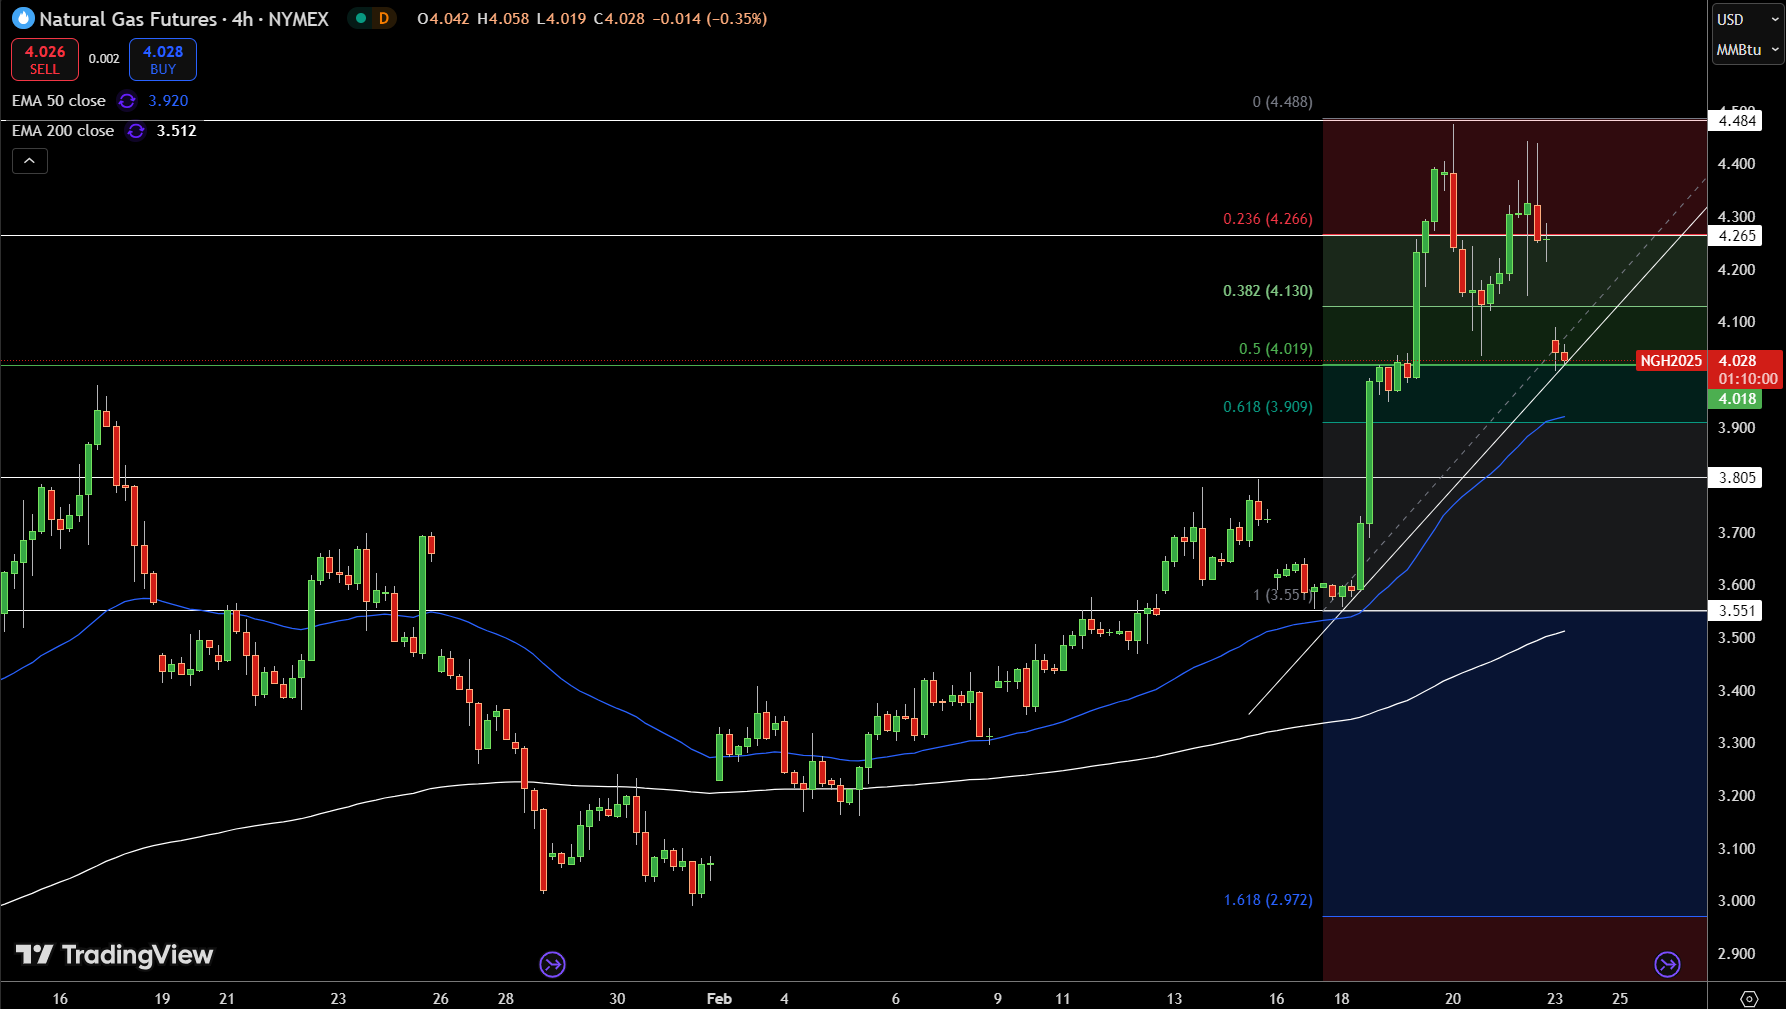
Natural Gas (NG) is trading at $3.98, just below the pivot point at $4.02, which is a crucial level to watch. If prices break above $4.02, immediate resistance is at $4.27, with a potential move toward $4.48 if bullish momentum builds.
Conversely, a drop below $4.02 could trigger selling pressure, testing support at $3.81 and possibly dipping to $3.55.
The 50 EMA at $3.92 provides short-term support, while the 200 EMA at $3.51 indicates long-term strength. As long as prices stay above the 50 EMA, the outlook remains cautiously bullish. Watch for a break above $4.02 for bullish confirmation. A fall below $3.92 could signal a bearish reversal.
WTI Oil Price Forecast
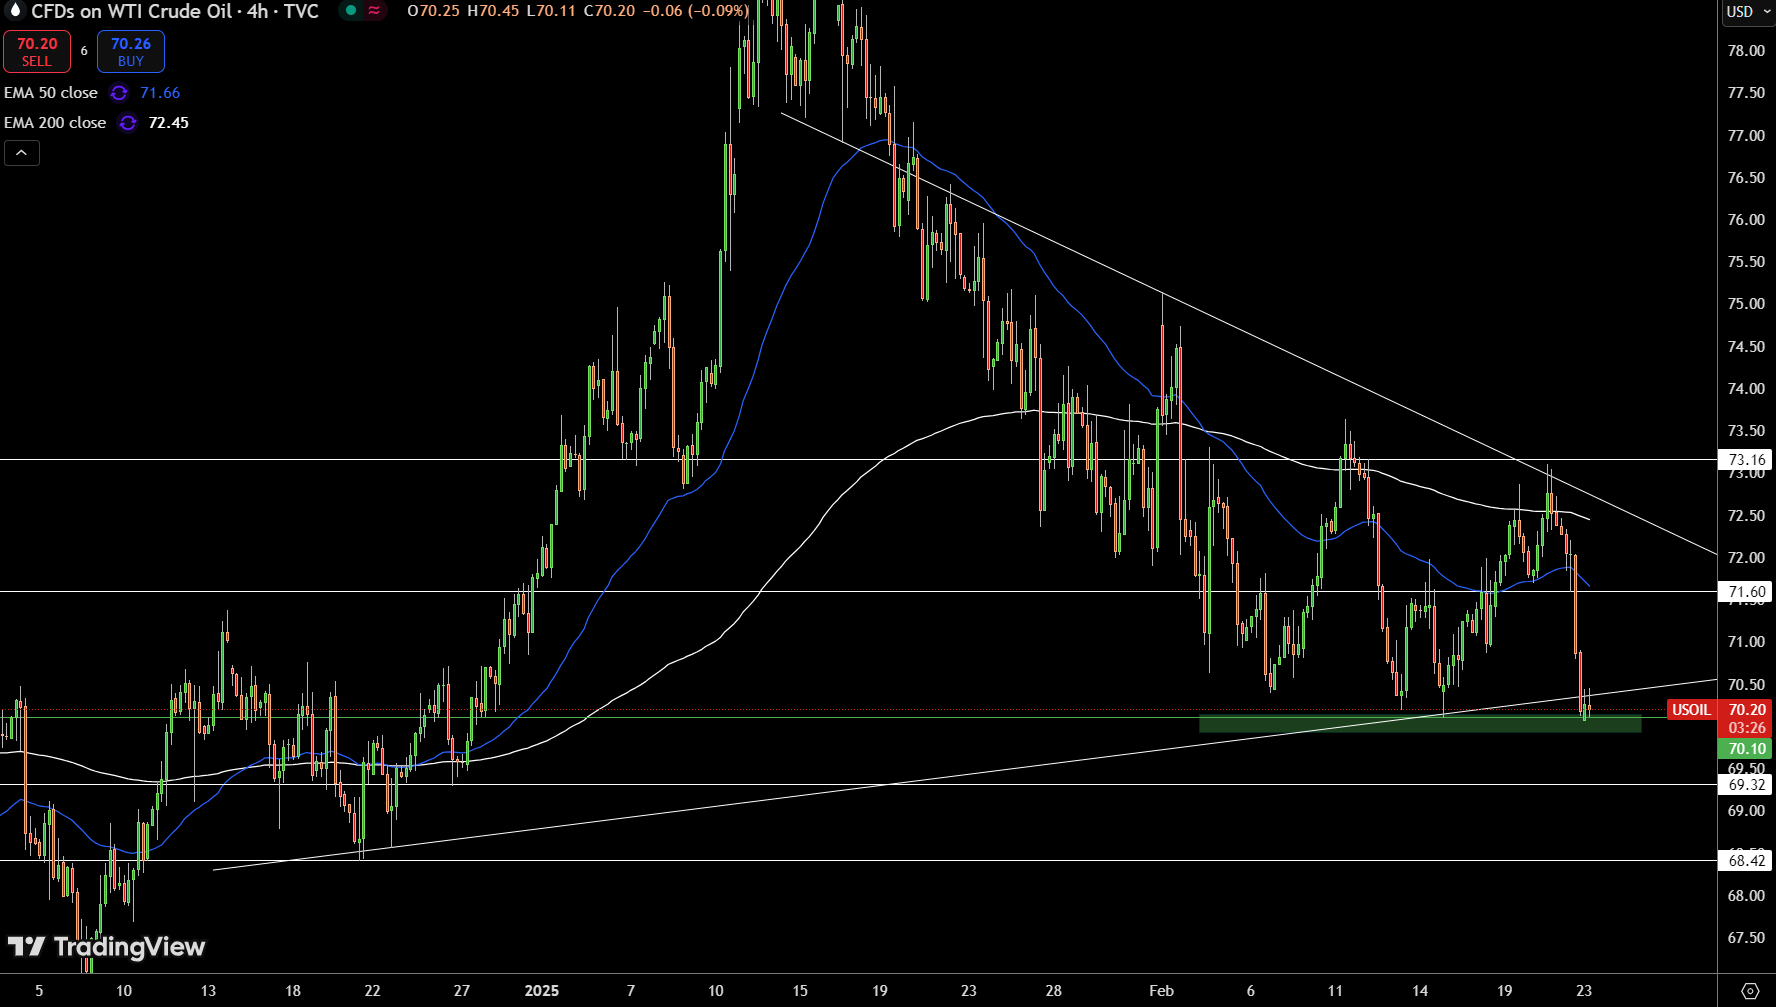
USOIL is holding steady at $70.20, right above the pivot point at $70.10. If prices move higher, the first resistance is at $71.60, followed by $73.16. On the downside, a break below $70.10 could see support at $69.32 and $68.42.
A double bottom pattern is forming, suggesting a potential bullish reversal. However, the 50 EMA at $71.66 and the 200 EMA at $72.45 are key resistance levels. Holding above $70.10 keeps the bullish outlook intact.
A decisive move above $71.60 confirms bullish sentiment. Traders should watch for a breakdown below $70.10 as a bearish signal.
Brent Oil Price Forecast
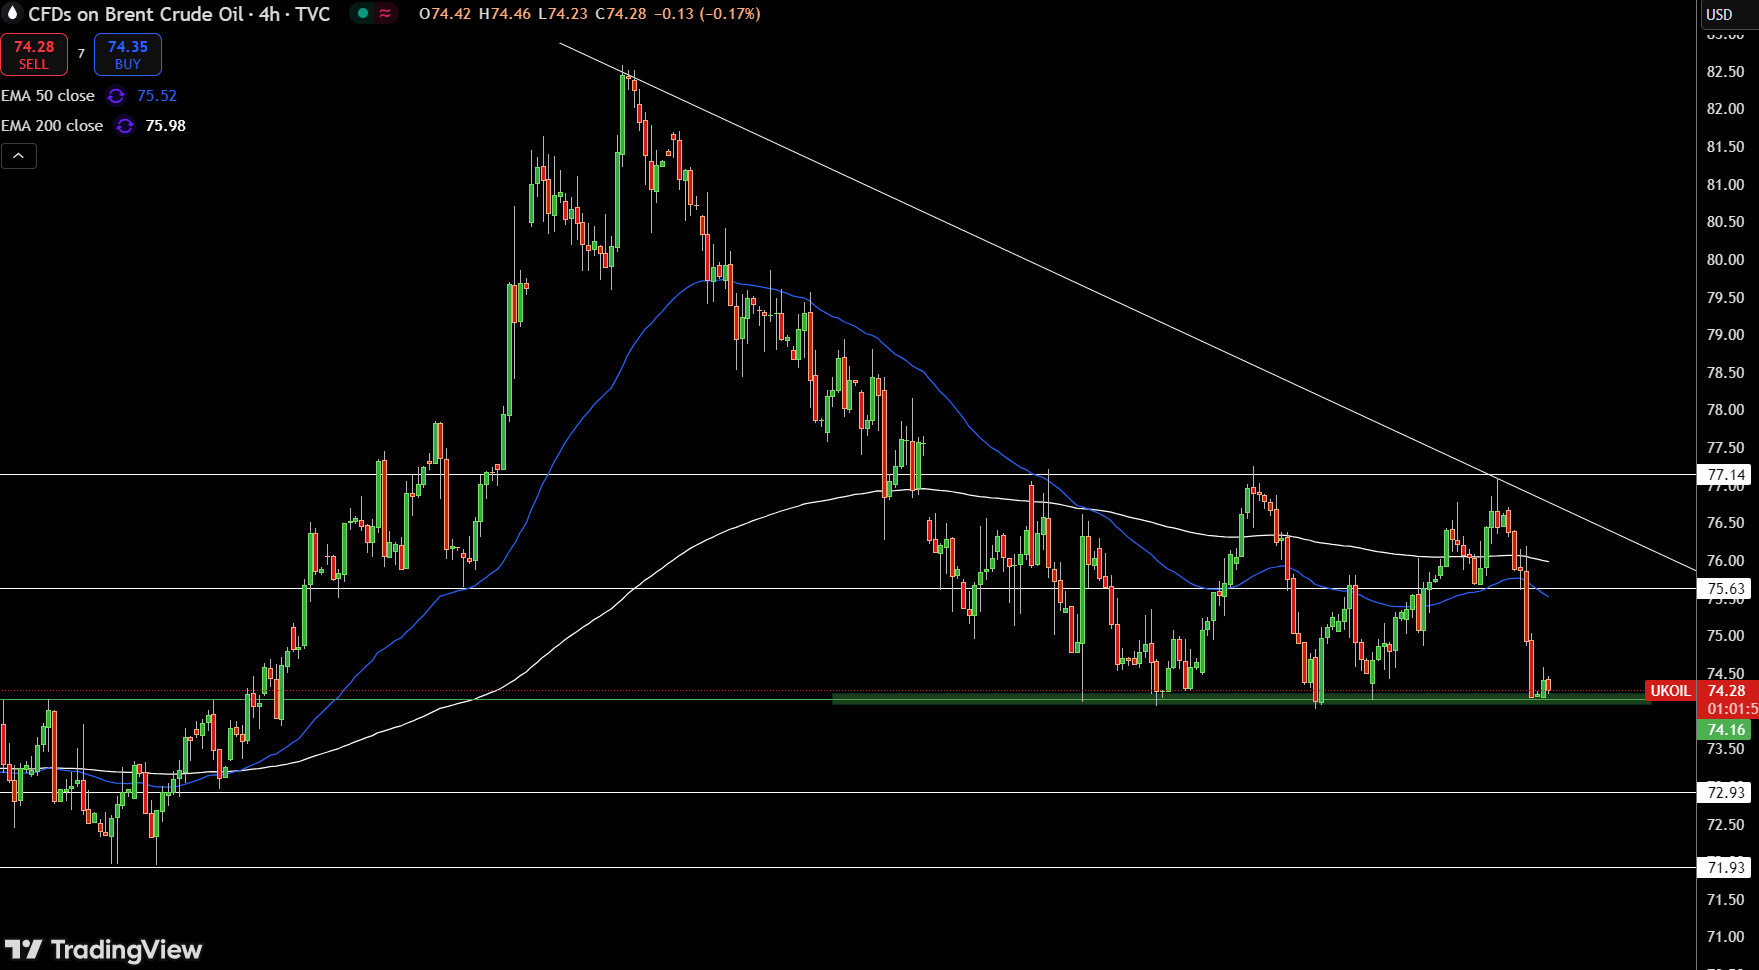
UKOIL is trading at $74.30, just above the pivot point of $74.16. A rise above this level could target $75.63 and possibly $77.14. On the downside, dropping below $74.16 could trigger selling pressure toward $72.93 and $71.93.
A triple bottom pattern hints at a bullish reversal, but the 50 EMA at $75.52 and the 200 EMA at $75.98 present strong resistance. Staying above $74.16 keeps the bullish outlook alive.
A breakout above $75.63 signals continued bullish momentum. Conversely, a drop below $74.16 would suggest renewed bearish pressure.
About the Author
Bob MasonChief Crypto Boss
TEST 30 He has written extensively for a broader audience and his current focus is on developments relating to the financial markets including, but not limited to currencies, commodities, alternative asset classes, and global equities.
Latest news and analysis


Advertisement