Advertisement
Advertisement

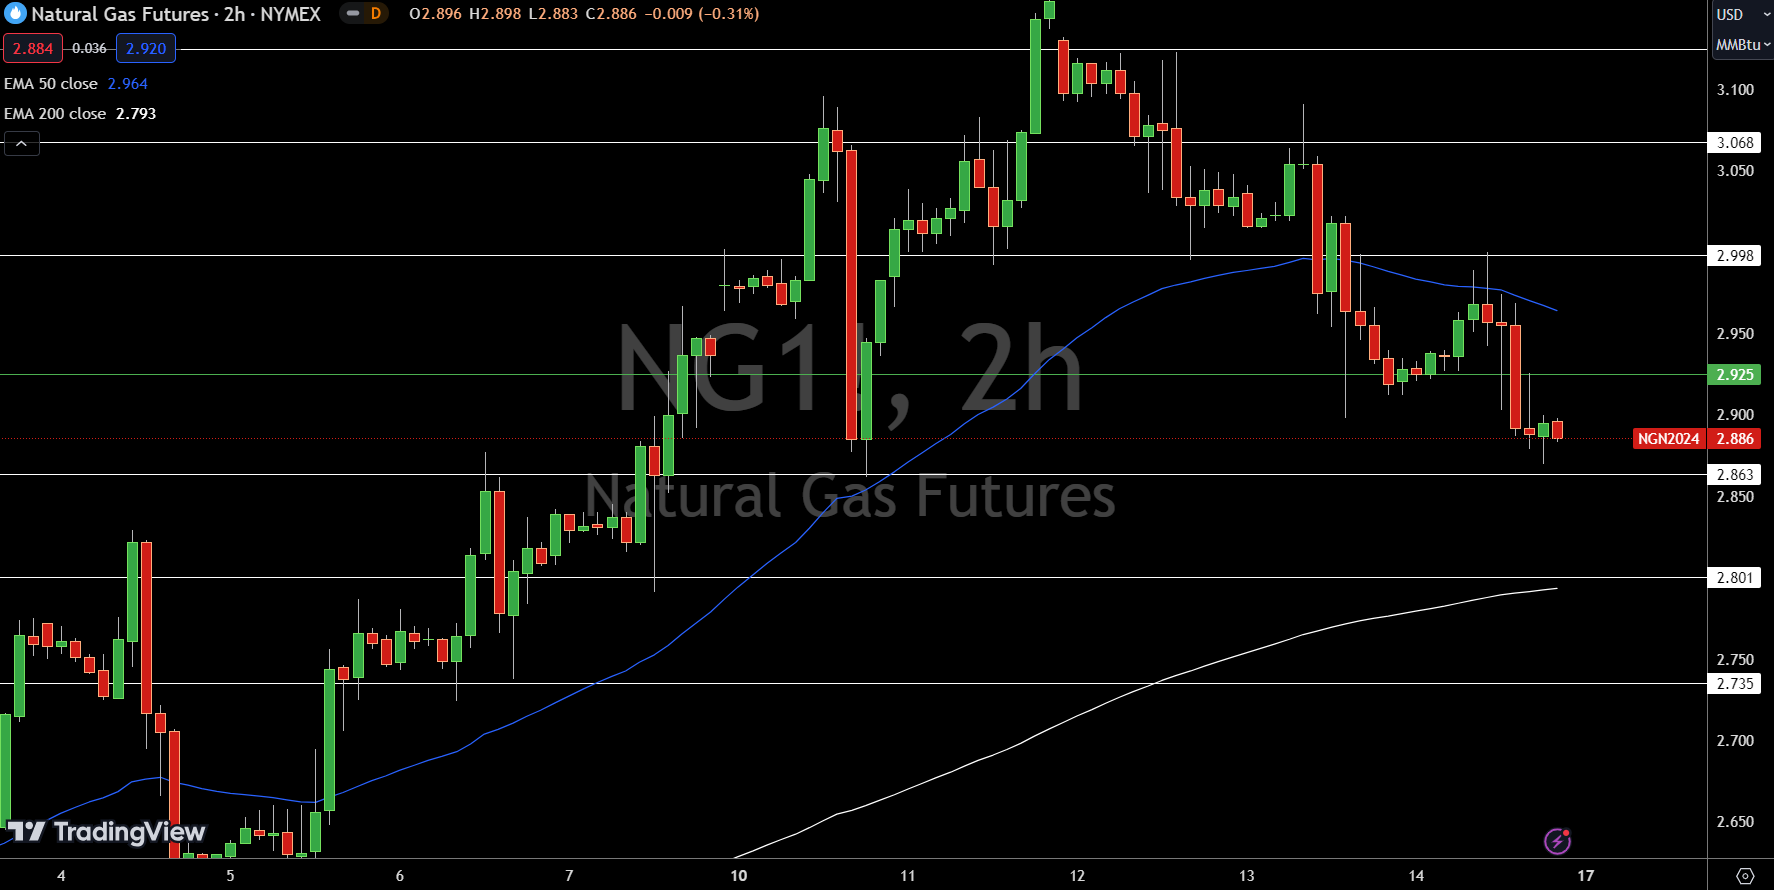
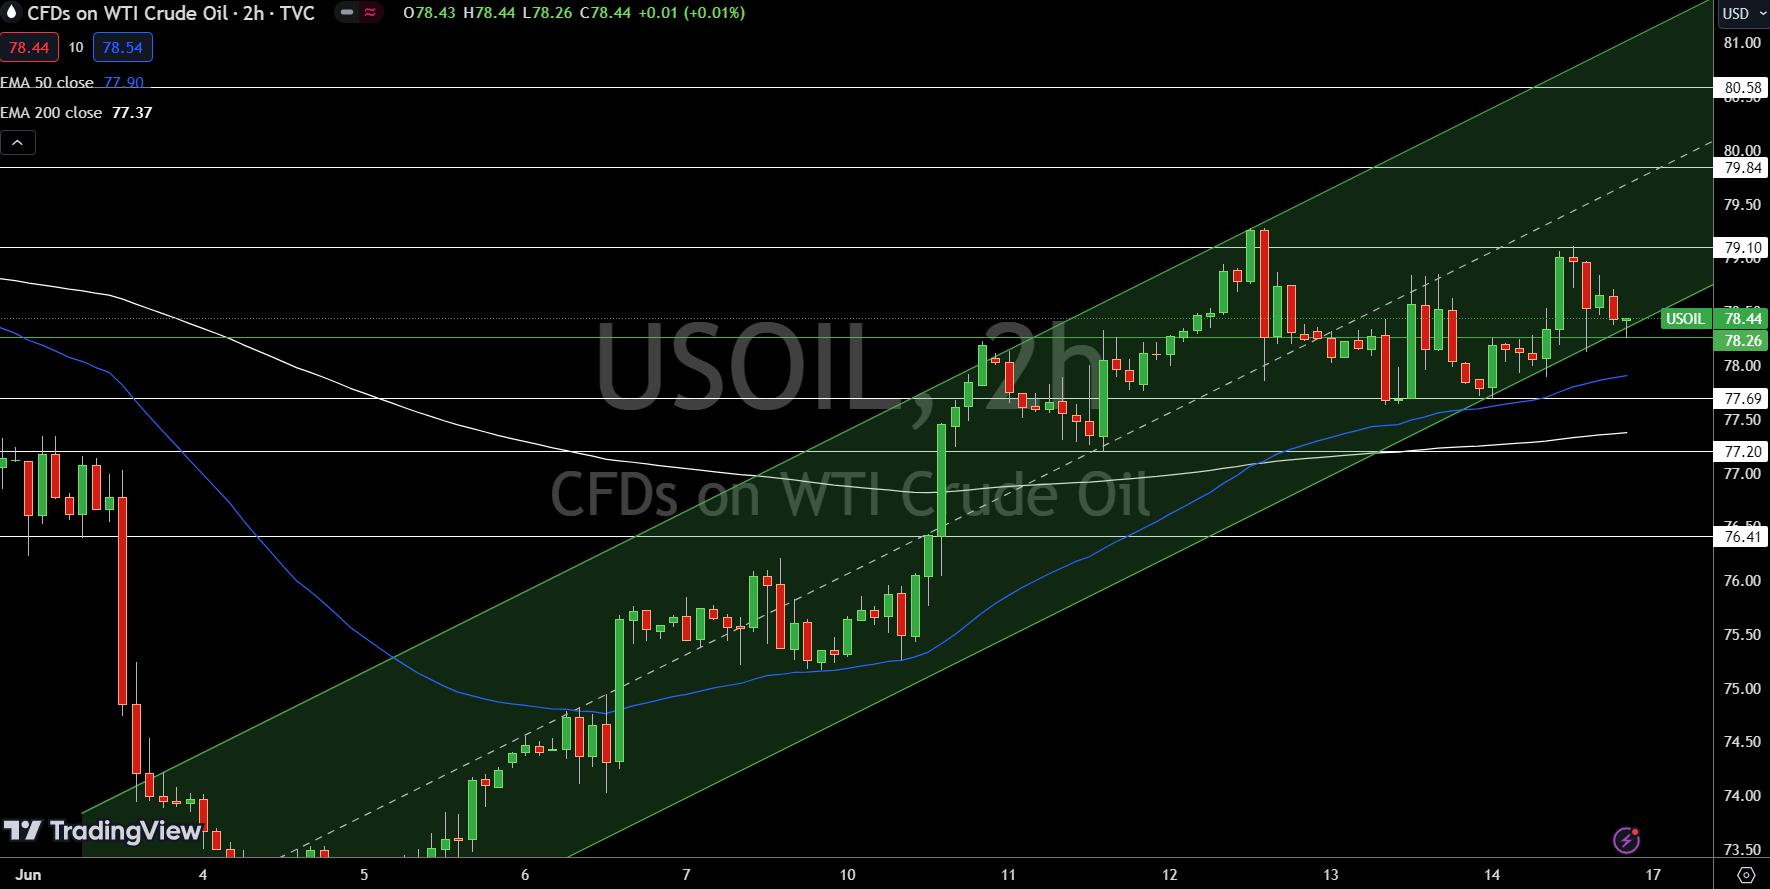
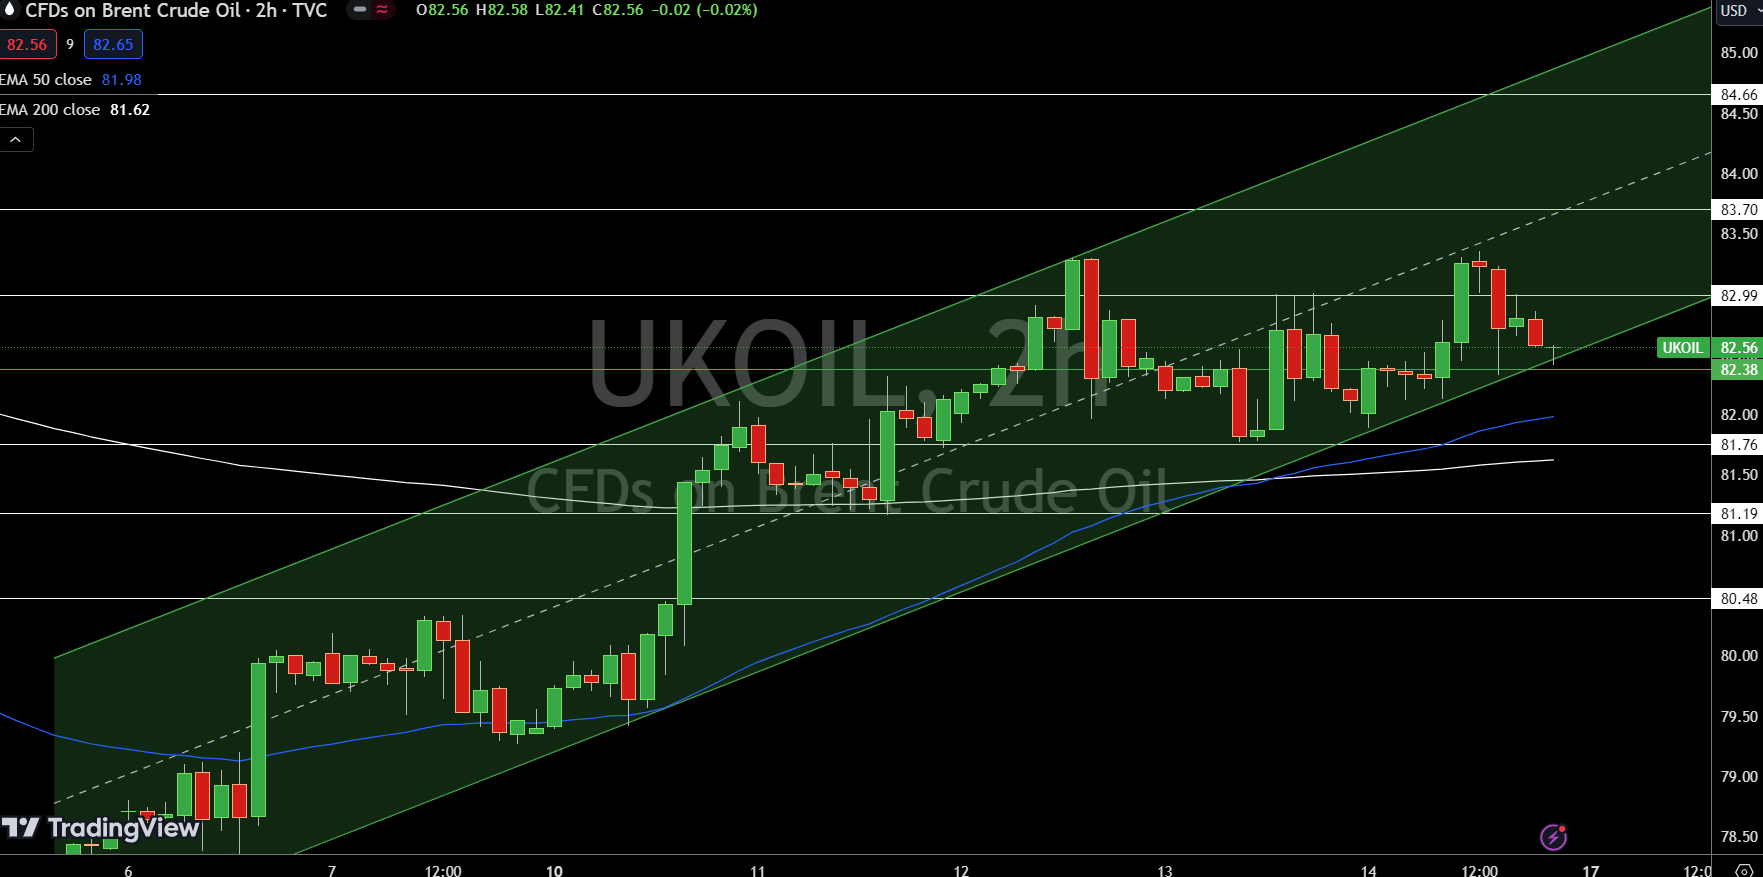
Natural Gas and Oil Forecast: Oil Supported, Bullish Bounce Ahead?

By:
Bob Mason
Published: Jun 17, 2024, 05:35 GMT+00:00

Key Points:

  • Oil prices ended the week with mixed signals, with a 4% gain offset by a Friday dip.
  • Conflicting demand forecasts for 2024 create uncertainty in the oil market.
  • US Federal Reserve's steady interest rates and falling rig count contribute to market uncertainty.
article from production

In this article:

Market Overview

Natural Gas (NG) prices fell on Monday, trading at $2.88, down 1.01%. The technical outlook remains bearish below the pivot point of $2.93, with immediate support at $2.86. A break below this level could trigger further declines towards $2.80 and $2.74.

The 50-day EMA currently sits at $2.96, above the 200-day EMA of $2.79, suggesting a potential bearish crossover. However, a break above the $2.93 pivot point could signal a shift in momentum, potentially driving prices towards $3.00 and $3.07.

WTI Oil Price Forecast

WTI Price Chart
WTI Price Chart

WTI Crude Oil (USOIL) prices surged on Monday, trading at $78.44, up 0.76%. The technical outlook remains bullish above the pivot point of $78.26, with immediate resistance at $79.10 and further upside potential towards $79.84 and $80.58.

The 50-day EMA currently sits at $77.90, above the 200-day EMA of $77.37, reinforcing the bullish momentum. However, a break below $78.26 could trigger a sharp reversal, potentially leading to a decline towards $77.69 and further down to $77.20 and $76.41.

Brent Oil Price Forecast

Brent Price Chart
Brent Price Chart

Brent Crude Oil (UKOIL) prices rose on Monday, trading at $82.56, up 0.54%. The technical outlook remains bullish above the pivot point of $82.38, with immediate resistance at $83.70 and further upside potential towards $83.99 and $84.66.

The 50-day EMA currently sits at $81.98, above the 200-day EMA of $81.62, reinforcing the bullish momentum. However, a break below $82.38 could trigger a sharp reversal, potentially leading to a decline towards $81.76 and further down to $81.19 and $80.48.

For a look at all of today’s economic events, check out our economic calendar.

About the Author

Bob MasonChief Crypto Boss

TEST 30 He has written extensively for a broader audience and his current focus is on developments relating to the financial markets including, but not limited to currencies, commodities, alternative asset classes, and global equities.

Did you find this article useful?

Advertisement