
Advertisement
Advertisement
Natural Gas and Oil Forecast: Reversal or Breakdown? Key Resistance Levels to Monitor
By:
Key Points:
- Oil prices face volatility as OPEC forecasts a 6% weekly drop in Brent and WTI, the largest since early September.
- Natural gas remains trapped below key resistance at $2.45, with potential for a bullish reversal above this level.
- Geopolitical risks ease, but weak Chinese economic data raises concerns about future crude oil consumption.

In this article:
Market Overview
Crude oil futures found some stability on Friday, buoyed by robust U.S. retail sales, yet ongoing geopolitical tensions have contributed to a significant decline in prices.
Both Brent and WTI are on track for a 6% drop this week, their largest weekly loss since early September, following revised lower demand forecasts from OPEC and the International Energy Agency.
Mixed economic indicators from China raise doubts about future consumption, as refinery output struggles amid weak fuel demand. Although some geopolitical risks have subsided, concerns about potential supply disruptions continue to create volatility in energy markets.
Natural Gas Price Forecast
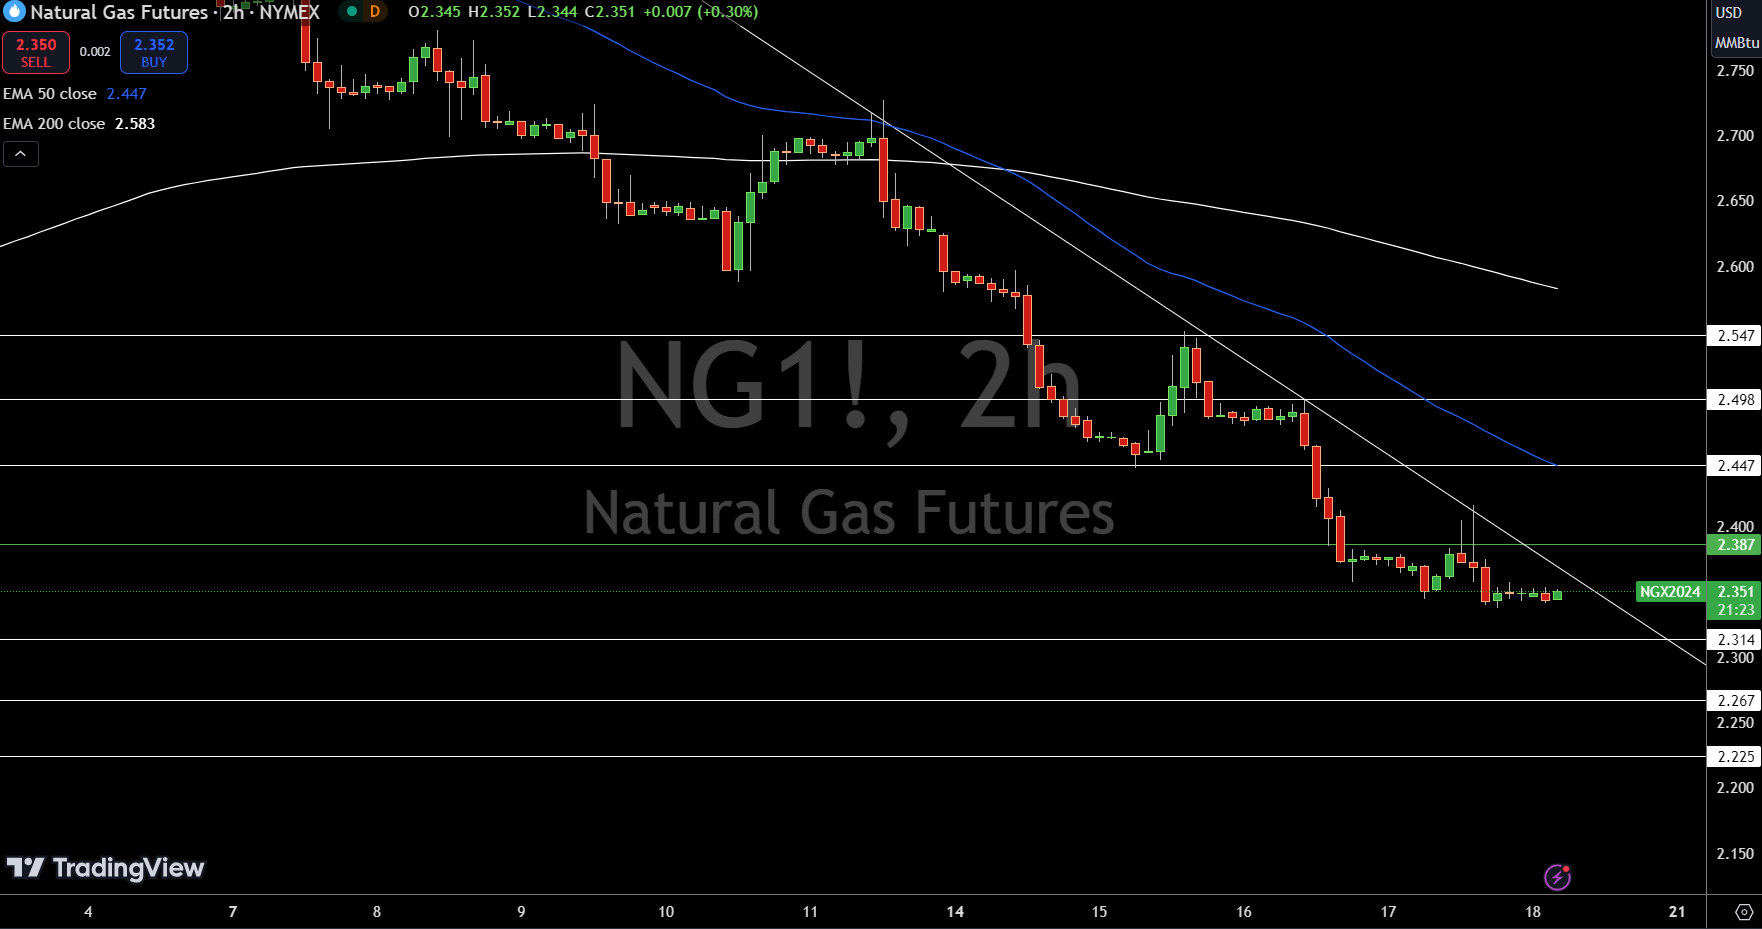
Natural Gas (NG) is currently trading at $2.70, up 0.45%, while continuing to encounter a downward trendline that is limiting further gains near $2.38. The 50-day EMA sits at $2.45, acting as an immediate resistance level. A breakout above this mark could push prices toward the next resistance levels of $2.50 and $2.55.
Conversely, support can be found at $2.31, followed by $2.27 and $2.23 below.
With the 200-day EMA at $2.58, the market seems poised for a potential reversal if bullish momentum continues. However, if prices dip below the pivot point of $2.39, a more bearish sentiment could dominate.
WTI Oil Price Forecast
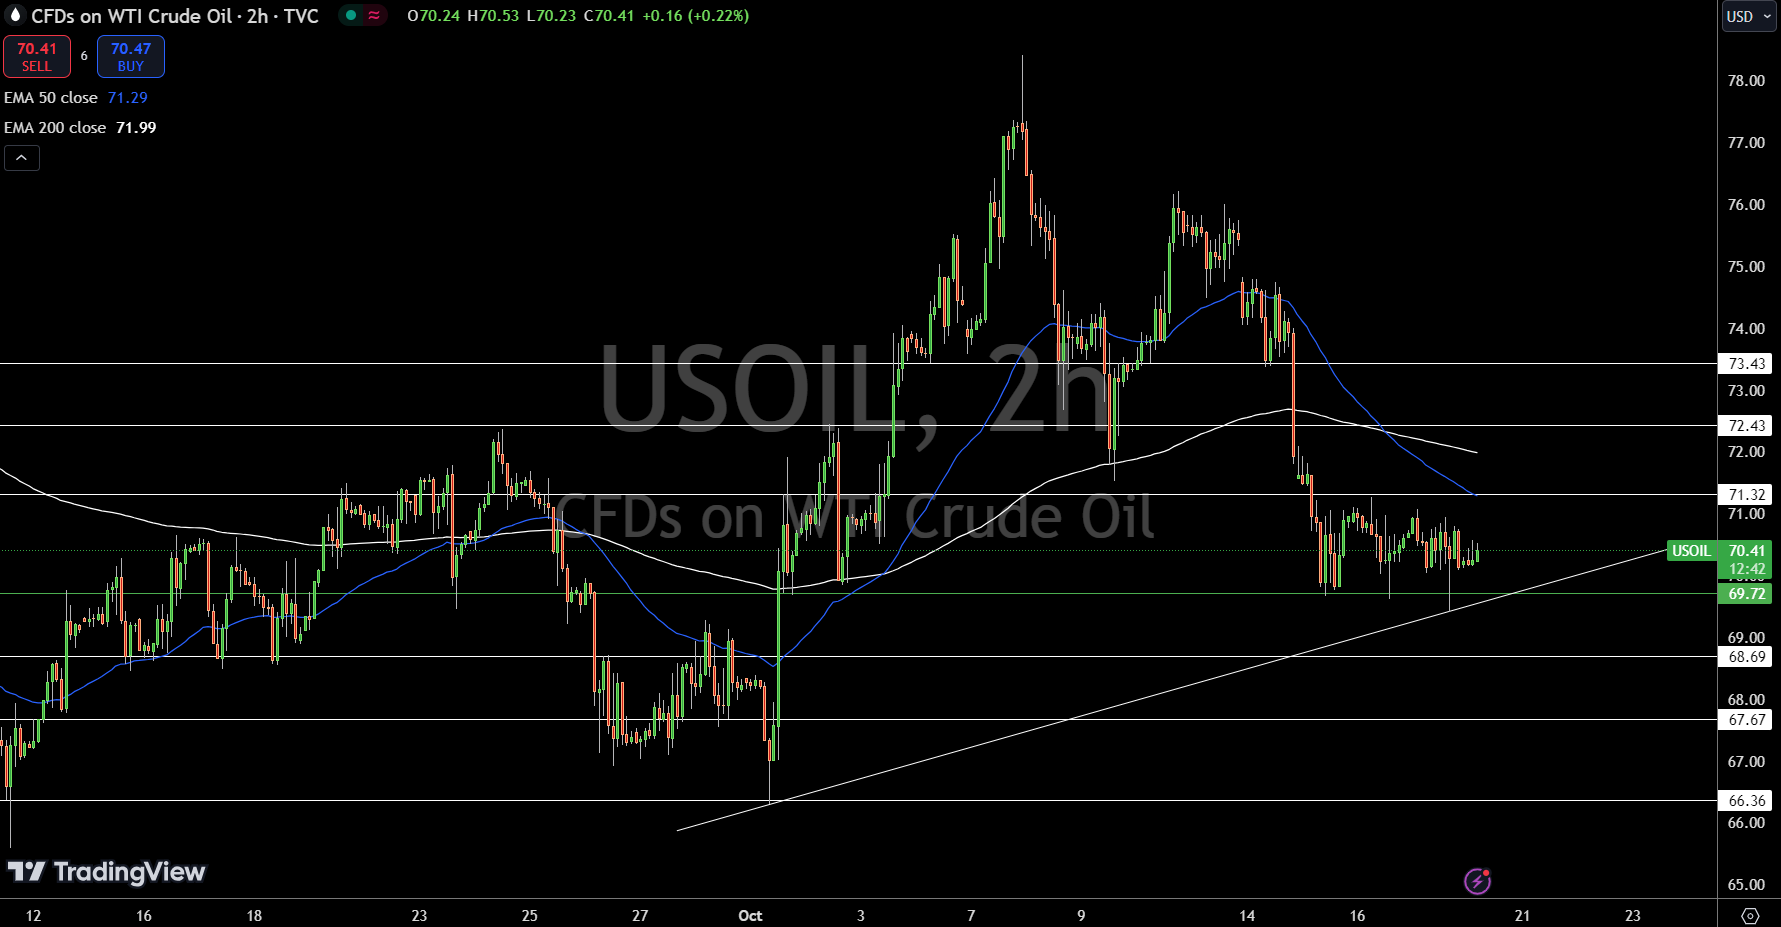
U.S. crude oil (USOIL) is trading at $70.40, up 0.38%, as it hovers above the key pivot point of $69.72. The price is supported by an upward trendline around this area, suggesting we could see a small bounce in the short term.
Immediate resistance is at $71.32, with further targets at $72.43 and $73.43 if bullish momentum picks up. On the downside, immediate support lies at $68.69, followed by deeper support levels at $67.67 and $66.36.
The 50-day EMA is at $71.29, and the 200-day EMA sits higher at $71.99, signaling key areas to watch. As long as prices remain above $69.72, the outlook stays positive, but a break below could trigger sharper selling pressure.
Brent Oil Price Forecast
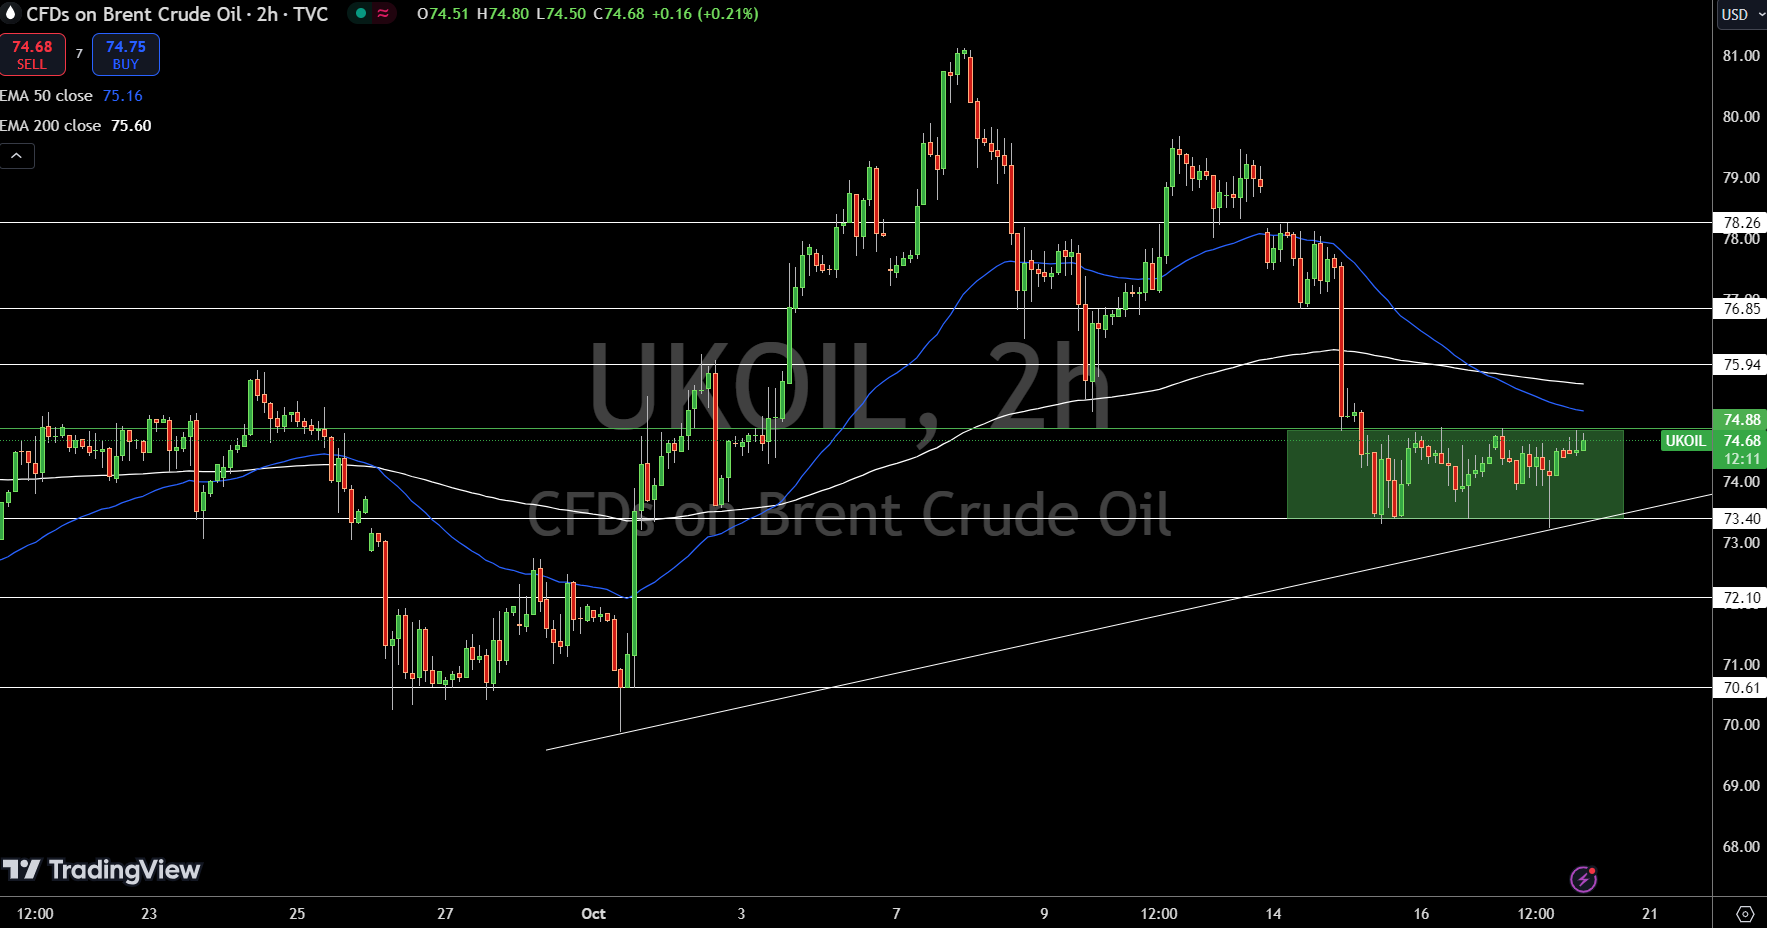
Brent crude (UKOIL) is currently priced at $74.68, up 0.76%, showing some stability just below the pivot point of $74.88. With an upward trendline offering support near this level, we could see a modest bounce if the price stays above it.
Immediate resistance is at $75.94, with further targets at $76.85 and $78.26 if momentum strengthens. On the downside, key support levels are at $73.40, $72.10, and $70.61.
The 50-day EMA sits at $75.16, and the 200-day EMA is just above at $75.60, indicating potential resistance ahead. As long as Brent remains above the $74.88 mark, the outlook stays bullish, but a break below could trigger a sharper sell-off.
About the Author
Bob MasonChief Crypto Boss
TEST 30 He has written extensively for a broader audience and his current focus is on developments relating to the financial markets including, but not limited to currencies, commodities, alternative asset classes, and global equities.
Latest news and analysis


Advertisement