
Advertisement
Advertisement
Natural Gas and Oil Forecast: Will OPEC+ Output Hike Break the $65 Floor?
By:
Key Points:
- Market Overview Oil and natural gas prices retreated following the de-escalation of recent geopolitical tensions in the Middle East, erasing much of the risk premium that had briefly pushed Brent above $80 per barrel. Despite last week marking the steepest weekly drop since March 2023, both Brent and WTI are on track to close June with gains exceeding 5%. Meanwhile, OPEC+ is expected to raise output by 411,000 barrels per day in August, marking a fifth straight monthly increase. However, soft global demand—highlighted by a third consecutive month of factory contraction in China and a declining U.S. rig count—continues to restrain bullish momentum. Natural Gas Price Forecast Natural Gas (NG) Price Chart Natural gas futures (NGQ2025) are trading near $3.654 after failing to extend a recovery beyond the 0.5 Fibonacci level at $3.758. Price briefly tested the 50-hour EMA and now appears to be stalling just above the 0.382 Fib level at $3.675. The short-term structure shows a textbook lower high after a strong bearish impulse from the $4.11 peak. The 200-hour EMA at $3.77 continues to cap upside attempts, reinforcing a bearish bias. If price drops below $3.641—the 50-EMA and local support—momentum may accelerate toward $3.571 and $3.494. Bulls need a sustained close above $3.758 to challenge $3.842, though macro fundamentals remain cautious. The broader structure leans corrective unless $3.96 is reclaimed decisively. WTI Oil Price Forecast WTI Price Chart WTI Crude Oil (USOIL) is hovering near $65.17, holding just above key ascending trendline support that originates from the June 13 low. Price action over the past few sessions suggests a descending triangle pattern is forming, marked by a series of lower highs capped under $67.10—a level that aligns with the 0.236 Fibonacci retracement of the recent $77.17 high. The 50-period EMA at $65.43 continues to act as dynamic resistance, with price repeatedly rejecting attempts to close above it. As long as USOIL stays below $67.10, the short-term structure remains pressured. A confirmed break below $64 would likely trigger a move toward $62.85 and potentially $61.27. However, if bulls can push above $67.10 with strong volume, it would invalidate the bearish pattern and open the path toward $69.02 and $70.58. Until then, crude remains range-bound with a bearish tilt. Brent Oil Price Forecast Brent Price Chart Brent Crude (UKOIL) is trading around $67.91, consolidating after last week’s sharp 15% drop from the $80.32 high. The price remains capped below the 0.236 Fibonacci level at $69.93 and is currently trapped between key moving averages—the 50-EMA at $69 and the 200-EMA near $71.57. Price action is sluggish, forming lower highs with minimal follow-through, suggesting sellers are still in control. The failure to reclaim the broken support near $69.90 adds to bearish weight. However, a base seems to be forming near $66.75, with short-term support holding for now. If bulls fail to clear $69.90, Brent could revisit $66.72 or even test deeper levels near $64.00. Only a strong close above $71.91 would neutralize the current bearish trend. (edited)
- Natural gas struggles below $3.758 as bearish technicals and weak fundamentals weigh on upside momentum.
- Brent retreats from $80 peak, stalls under $69.93 resistance, with sellers still controlling price action.

Market Overview
Oil and natural gas prices retreated following the de-escalation of recent geopolitical tensions in the Middle East, erasing much of the risk premium that had briefly pushed Brent above $80 per barrel. Despite last week marking the steepest weekly drop since March 2023, both Brent and WTI are on track to close June with gains exceeding 5%.
Meanwhile, OPEC+ is expected to raise output by 411,000 barrels per day in August, marking a fifth straight monthly increase. However, soft global demand—highlighted by a third consecutive month of factory contraction in China and a declining U.S. rig count—continues to restrain bullish momentum.
Natural Gas Price Forecast
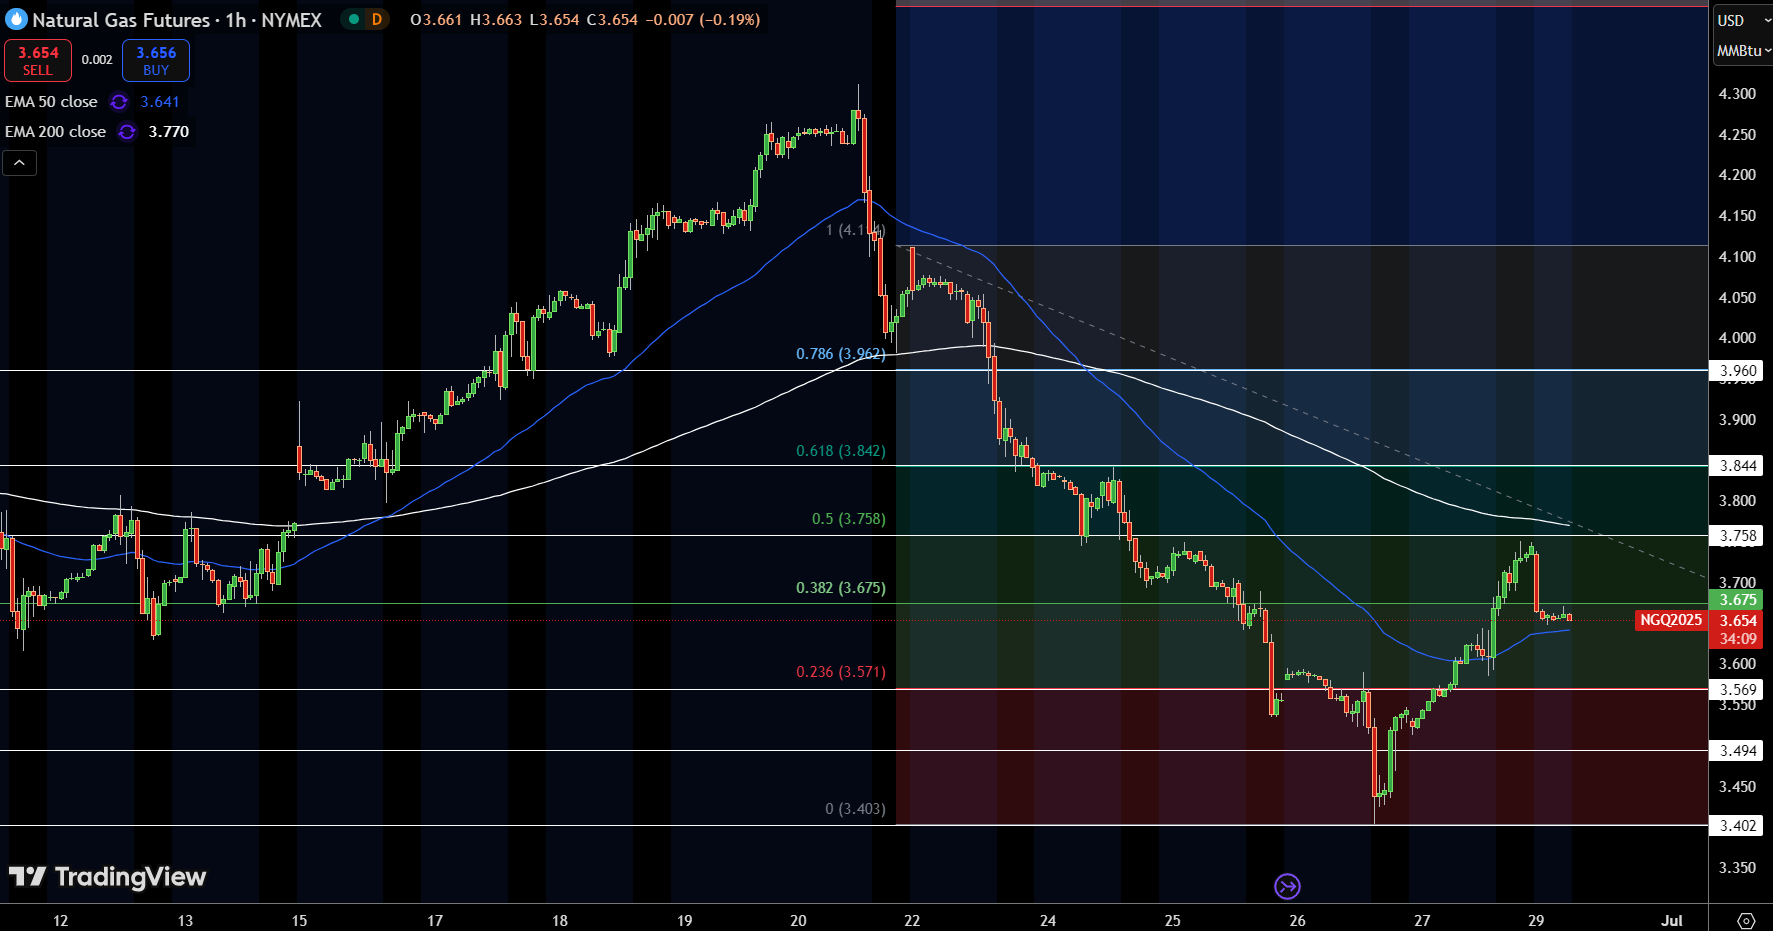
Natural gas futures (NGQ2025) are trading near $3.654 after failing to extend a recovery beyond the 0.5 Fibonacci level at $3.758. Price briefly tested the 50-hour EMA and now appears to be stalling just above the 0.382 Fib level at $3.675.
The short-term structure shows a textbook lower high after a strong bearish impulse from the $4.11 peak. The 200-hour EMA at $3.77 continues to cap upside attempts, reinforcing a bearish bias.
If price drops below $3.641—the 50-EMA and local support—momentum may accelerate toward $3.571 and $3.494. Bulls need a sustained close above $3.758 to challenge $3.842, though macro fundamentals remain cautious. The broader structure leans corrective unless $3.96 is reclaimed decisively.
WTI Oil Price Forecast
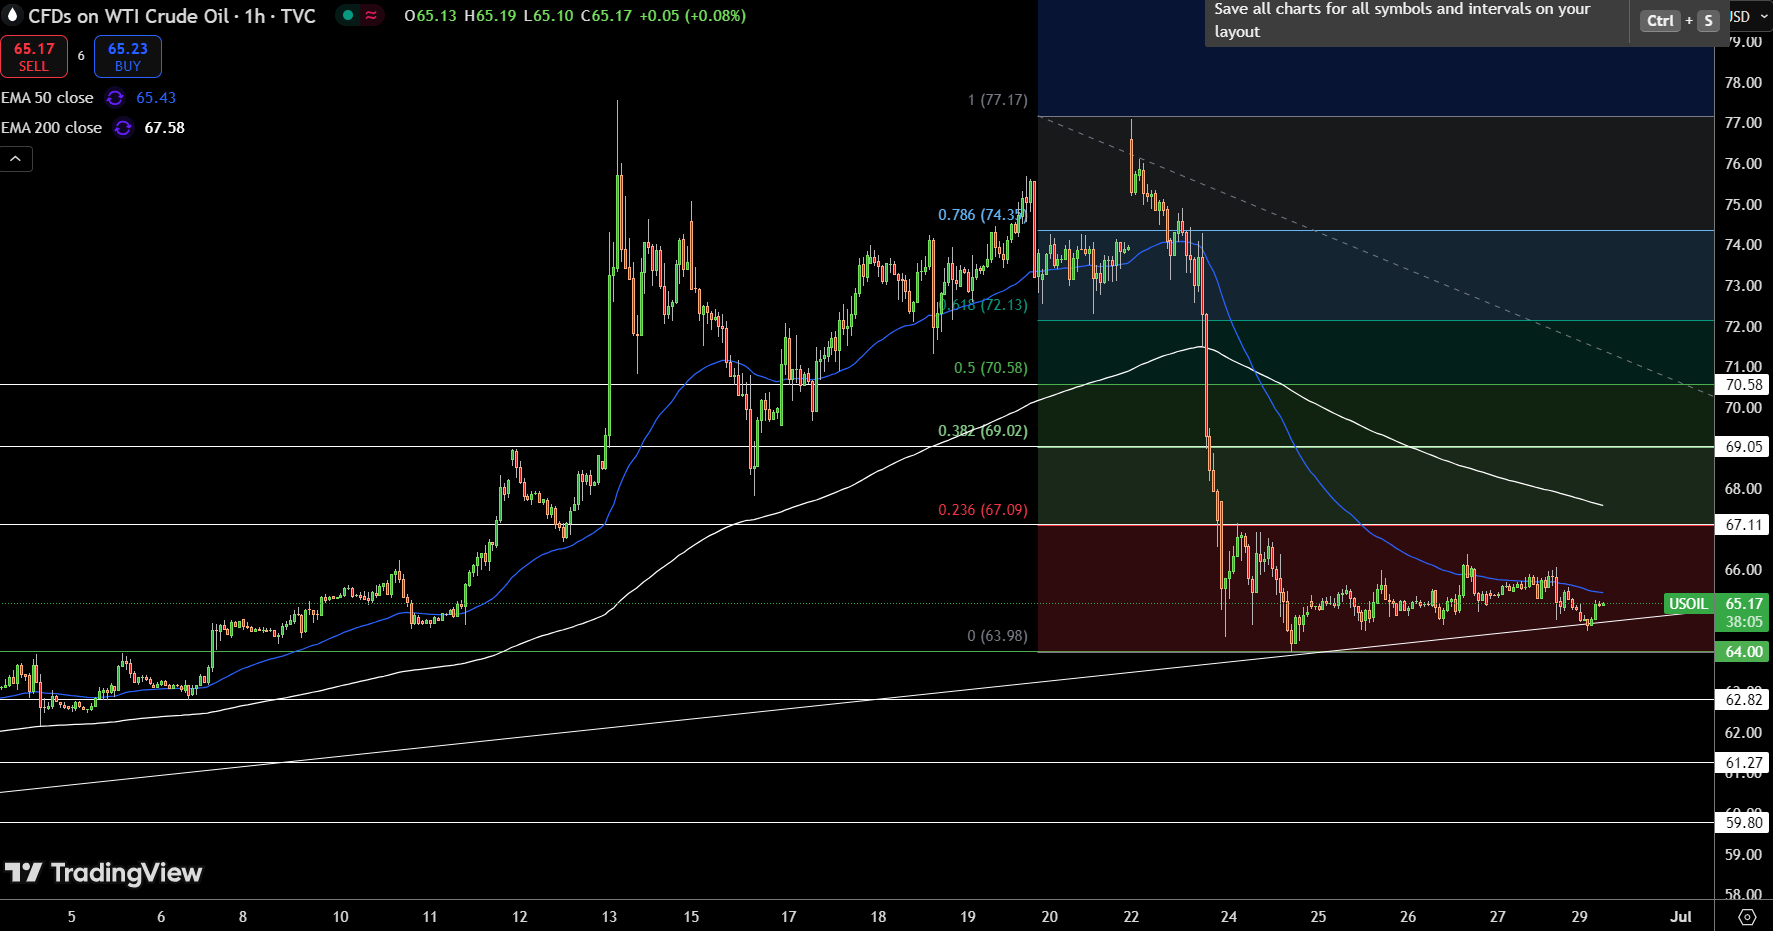
WTI Crude Oil (USOIL) is hovering near $65.17, holding just above key ascending trendline support that originates from the June 13 low. Price action over the past few sessions suggests a descending triangle pattern is forming, marked by a series of lower highs capped under $67.10—a level that aligns with the 0.236 Fibonacci retracement of the recent $77.17 high.
The 50-period EMA at $65.43 continues to act as dynamic resistance, with price repeatedly rejecting attempts to close above it. As long as USOIL stays below $67.10, the short-term structure remains pressured. A confirmed break below $64 would likely trigger a move toward $62.85 and potentially $61.27.
However, if bulls can push above $67.10 with strong volume, it would invalidate the bearish pattern and open the path toward $69.02 and $70.58. Until then, crude remains range-bound with a bearish tilt.
Brent Oil Price Forecast
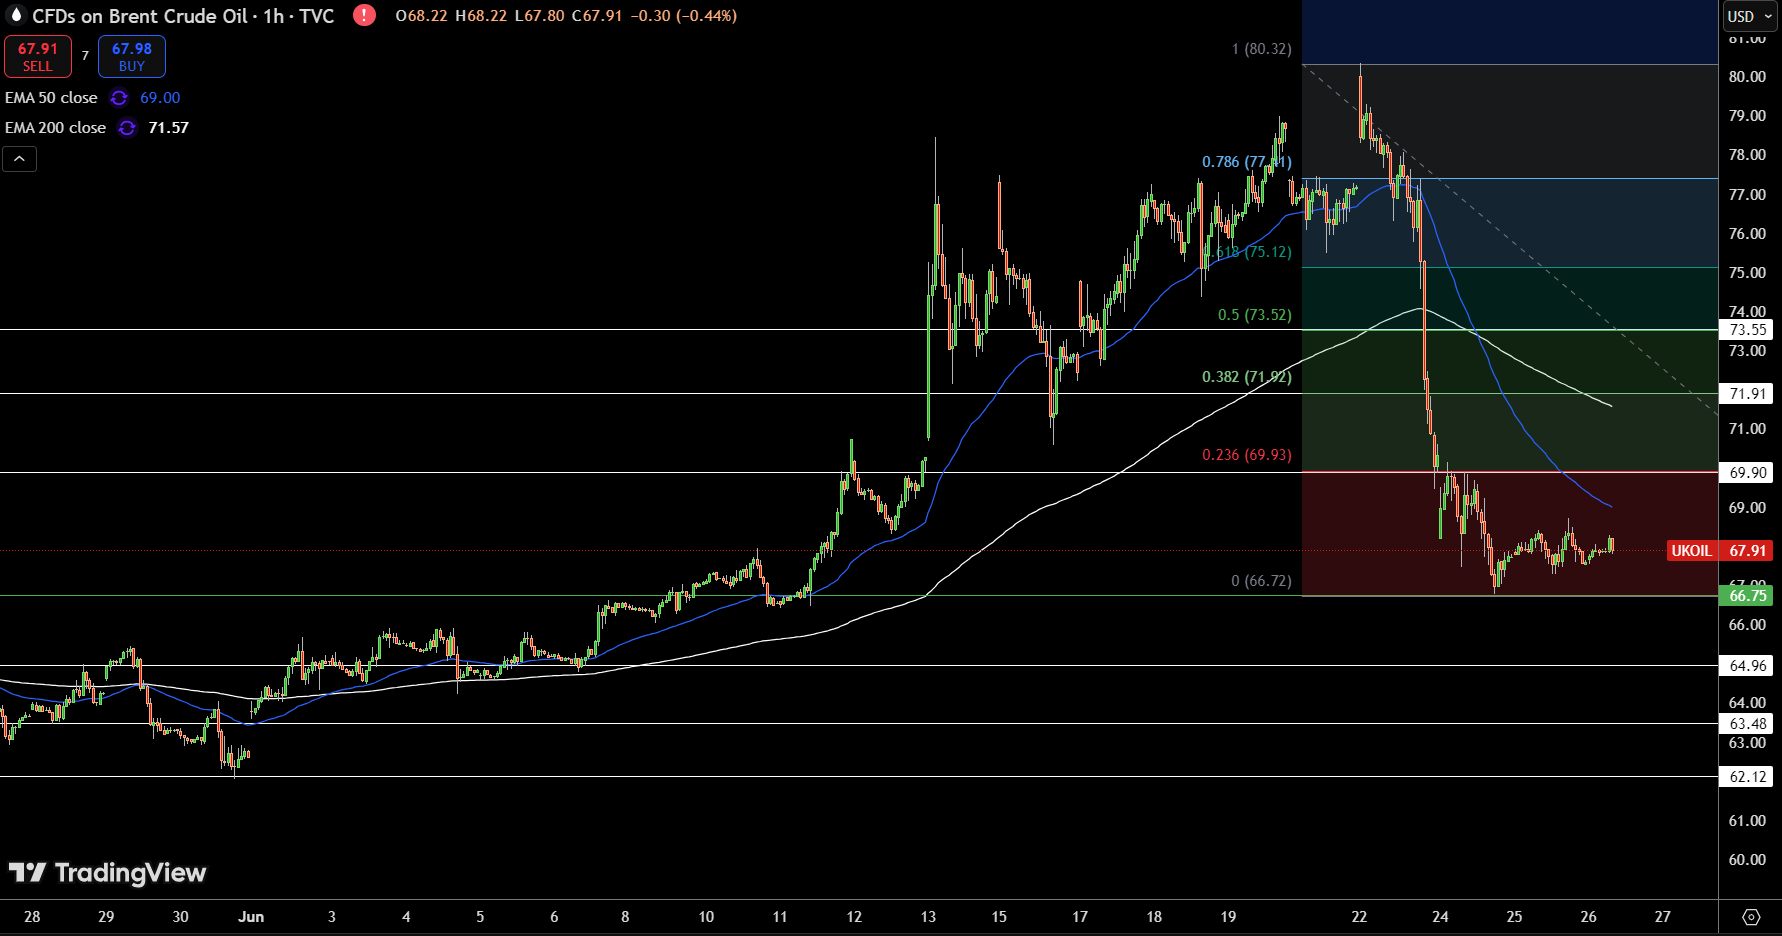
Brent Crude (UKOIL) is trading around $67.91, consolidating after last week’s sharp 15% drop from the $80.32 high. The price remains capped below the 0.236 Fibonacci level at $69.93 and is currently trapped between key moving averages—the 50-EMA at $69 and the 200-EMA near $71.57.
Price action is sluggish, forming lower highs with minimal follow-through, suggesting sellers are still in control. The failure to reclaim the broken support near $69.90 adds to bearish weight. However, a base seems to be forming near $66.75, with short-term support holding for now.
If bulls fail to clear $69.90, Brent could revisit $66.72 or even test deeper levels near $64.00. Only a strong close above $71.91 would neutralize the current bearish trend. (edited)
About the Author
Bob MasonChief Crypto Boss
123456789 30 He has written extensively for a broader audience and his current focus is on developments relating to the financial markets including, but not limited to currencies, commodities, alternative asset classes, and global equities.


Advertisement