
Advertisement
Advertisement
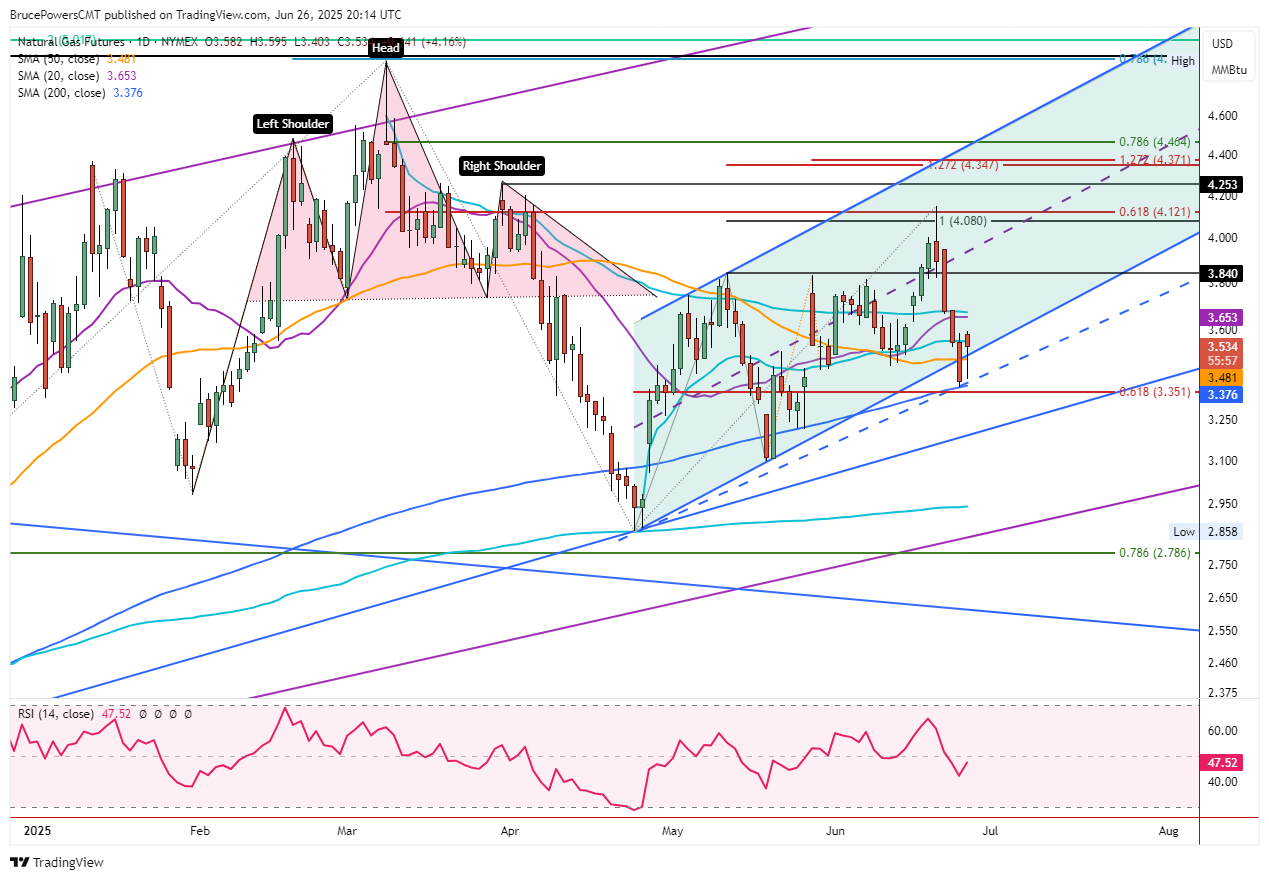
Natural Gas Price Forecast: Bounces from Support at 200-Day Moving Average
By:
A quick recovery above $3.48 and strong daily close suggests buyers are regaining control, with a breakout possible above the $3.60 high from Thursday.
Natural gas bounced off support at the 200-Day MA (blue) on Thursday, after it was tested with Wednesday’s low of $3.37. There were several signs of strength seen in today’s price action. Both a rising trendline and the 50-Day MA were reclaimed on a rally to the day’s high of $3.60. Further, it looks like the recovery will be confirmed by a daily close today above both lines. However, the 50-Day line has greater significance as the trendline was broken yesterday.
It is currently at $3.48. Despite the quick recovery, a decisive rally above Wednesday’s high of $3.59 is needed for a swing low to be created. Once established, the immediate lower rising trendline will be adjusted to touch that low. Currently, there is a rising dashed blue line in its place.
Signs of Strength
There were a couple other signs of strength today to be aware of. At the time of this writing, trading continues in the upper half of the day’s range. Therefore, the day may end with natural gas in a similar position. That would set up a bullish hammer candlestick pattern. Although it didn’t form at the bottom of the trend, it is close. Also, today’s high was $3.60, slightly above Wednesday’s high of $3.59. This shows strength and is a sign that buyers are moving back into the market.
Test of 200-Day MA Shows Relative Strength
Of course, the 200-Day MA represents potentially significant dynamic long-term trend support. It was tested twice recently. Once during the decline in April and again in May. Notice that that first approach fell further below the line and for more days than the second test. In both instances, the bullish recovery came quickly, once it started. If yesterday’s low turns into a swing low, it will show strength relative to the two prior declines to the 200-Day line.
Bull Breakout Above $3.60
A bull breakout will be indicated on a decisive rally above today’s high of $3.60. Near term support is at the 50-Day MA and the low for today, which is $3.40. An area of potential resistance is at the 20-Day MA, now at $3.65, and Tuesday’s high of $3.68. Further strengthening would change the slope of the rising trend channel as currently identified in green. The midline of the channel would be a first target zone if the bulls can retain control.
For a look at all of today’s economic events, check out our economic calendar.
About the Author
Bruce Powerscontributor
Bruce has been involved in the financial markets for over 20 years, as an analyst, trader, educator, and writer.


Advertisement