
Advertisement
Advertisement
Natural Gas Price Forecast: Gas Weakens as Key Support Levels Tested
By:
Natural gas deepened its pullback, breaking key support at $3.50, and is now vulnerable to further downside toward the 61.8% Fibonacci level.
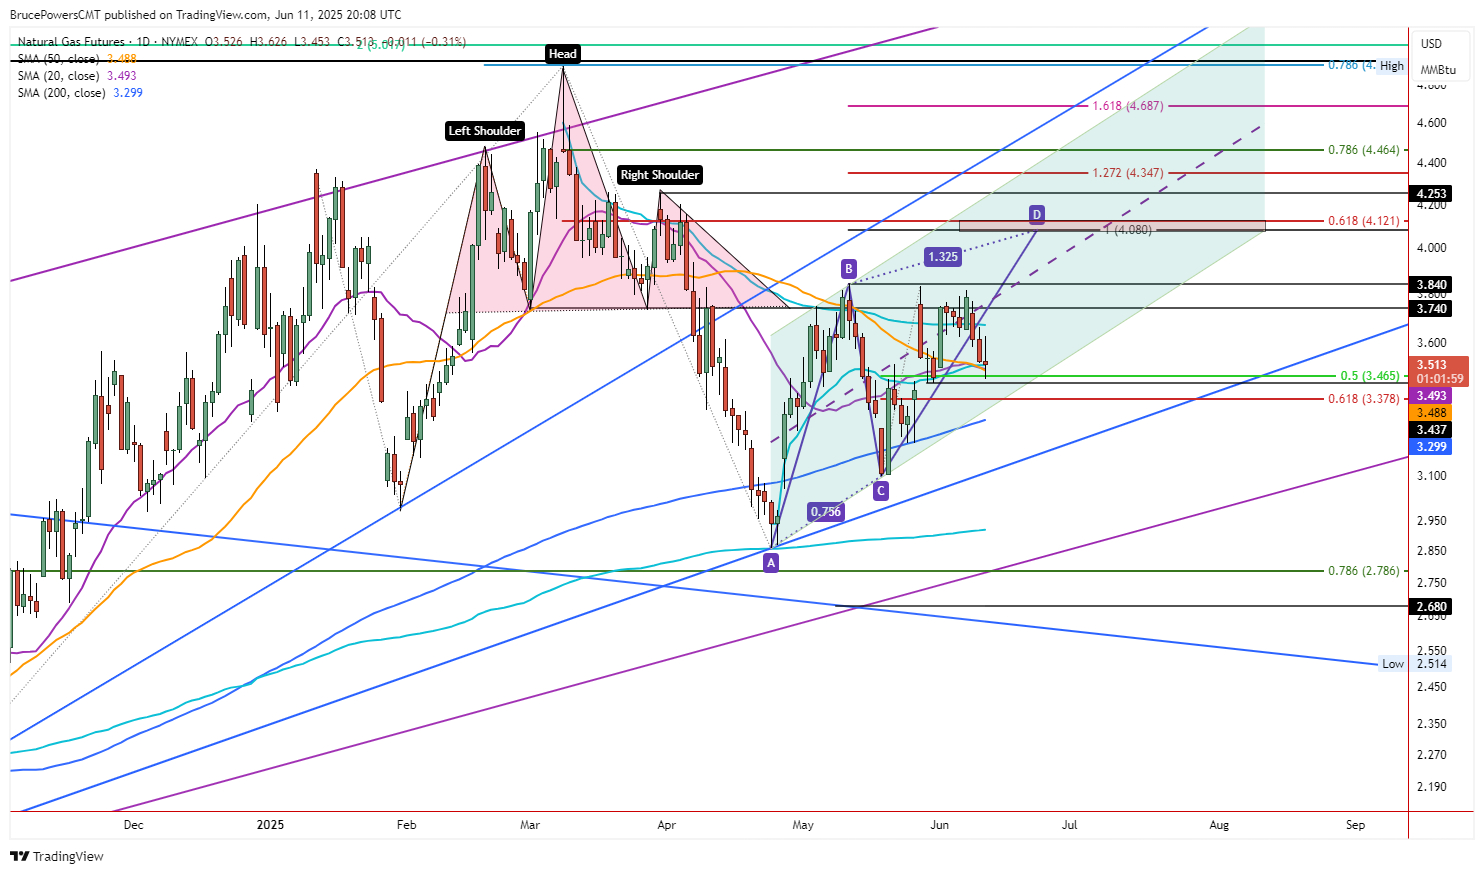
Natural gas deepened its pullback from last Friday’s high on Wednesday, reaching a low of $3.45. The day’s low was a retest of support around a 50% retracement. Buyers subsequently took control and established support for the day. A lower daily high and low will complete today, while potential support around the 50-Day MA, now at $3.49, failed initially.
But if the day’s session can close at or above that price level, the 50-Day line will have been quickly reclaimed, which would be a minor sign of strength. That price level takes on added significance since the 20-Day MA has converged with the 50-Day line and it is therefore identifying the same potential support level.
50-Day Moving Average Provides a Guide
Although price levels indicated by the moving averages can provide a guide, they are not as reliable in a consolidating environment as seen recently. The higher swing low at $3.44 shows a potentially more significant price level as it is part of a possible CD leg of a developing rising ABCD pattern (purple). Given the downward pressure shown today, that price level is at risk of being broken.
Furthermore, weakness today triggered a breakdown below last week’s low of $3.50 and created a lower weekly low and lower high. Therefore, a daily close below $3.50 confirms the breakdown on a daily basis, while a potential weekly confirmation will have to wait until the end of day on Friday.
Weekly Breakdown Triggers
It is interesting to note that the past few weeks have shown a series of lower weekly highs on the weekly chart (not shown). That pattern occurred as natural gas was attempting to break above resistance established at the early-May swing high of $3.84. Now that a weekly low was busted, it provides another bearish indication but on the higher time frame. Moreover, there was a potentially bearish shooting start candlestick pattern generated two weeks ago. The pattern suggested potential difficulty in exceeding the $3.84 high as well.
Lower Price Levels
If natural gas falls below today’s low and then the $3.44 low, it looks likely to head for a test of support around the 61.8% Fibonacci retracement at $3.38. That is also close to the weekly opening price two weeks ago.
For a look at all of today’s economic events, check out our economic calendar.
About the Author
Bruce Powerscontributor
Bruce has been involved in the financial markets for over 20 years, as an analyst, trader, educator, and writer.


Advertisement