
Advertisement
Advertisement
Natural Gas Price Forecast: Struggles Below Key Levels, Bearish Risk Increases
By:
Consolidation persists as natural gas struggles under the 20-Day MA. Bearish divergence in RSI suggests downside risks, with key levels at $3.955, $3.85, and $3.74.
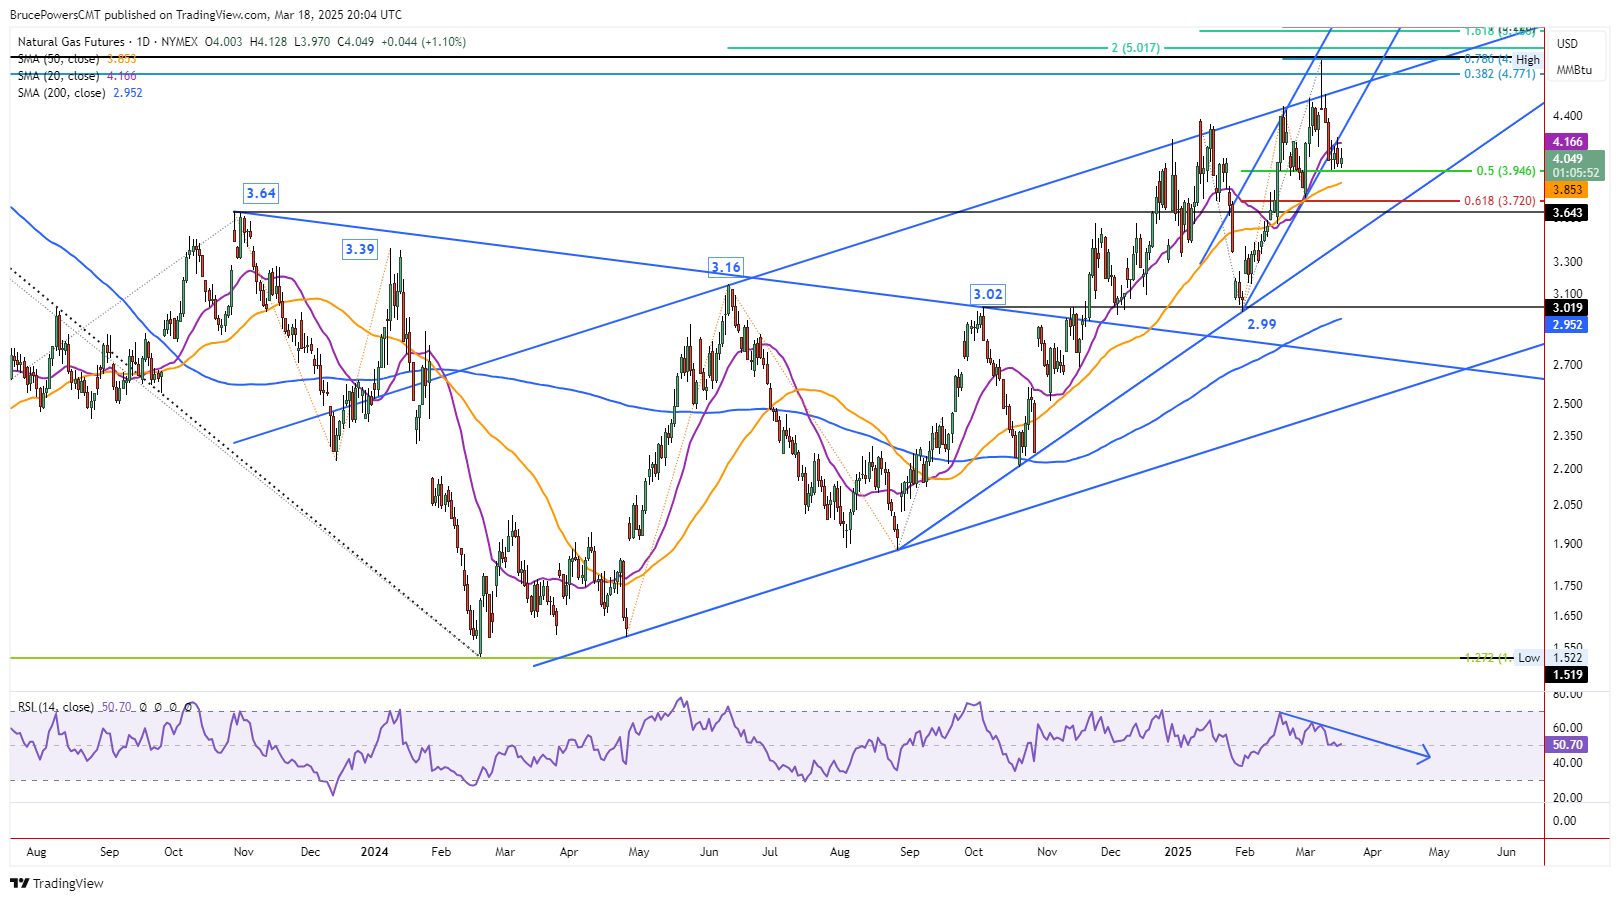
Natural gas consolidated in a relatively narrow range for the fourth day on Tuesday. It established a lower daily high of $4.13 and a slightly lower daily low of $3.97. The high for the day found resistance below the 20-Day MA, now at $4.17, for the second time in four days. Previously, the 20-Day MA and nearby rising trendline represented potential support, and now they represent resistance. A high resistance level for the four-day price range is $4.22, and the low of the range is $3.955.
Bearish Breakdown Impact Remains
Given the drop below both the 20-Day line and trendline last week, and subsequent daily closes below each line, natural gas looks to be preparing for a continuation to the downside. In addition, there is a bearish divergence in the relatively strength index (RSI) momentum oscillator, as the indicator shows a declining trend that began while natural gas was completing its recent rally. However, since there are potential support levels not too much lower, the bearish continuation may not go far.
Key Near-term Support at $3.955
Nevertheless, a decisive decline below $3.955 signals a bearish continuation of the pullback. The next lower targets are then the 50-Day MA at $3.85 currently, and a price range of $3.74 to $3.72, consisting of the more recent swing low and the 61.8% Fibonacci retracement, respectively. In addition, the 61.8% level can be watched along with the $3.64 price area as it was a high in 2023 and could represent support as it approached from the upside.
Bearish Trend Reversal Risk
If there is a decline below the prior swing low at $3.74 and the price of natural gas stays below it, there is a risk of a bearish trend reversal of the upswing that began from the $2.99 interim swing low. Such a bearish reversal would be confirmed by a daily close below that swing low. That would put the next lower uptrend in sight for a test as support.
Behavior Around 50-Day Line to Provide Clues
Since the 50-Day MA is rising it is possible that natural gas continues to consolidate until the 50-Day is closer to or reached the $3.955 to $4.22 price zone. In that case, strength would have been maintained, and it could establish a floor before another rally attempt.
For a look at all of today’s economic events, check out our economic calendar.
About the Author
Bruce Powerscontributor
Bruce has been involved in the financial markets for over 20 years, as an analyst, trader, educator, and writer.
Did you find this article useful?
Latest news and analysis


Advertisement