
Advertisement
Advertisement
Natural Gas Price Forecast: Weakens Within Bullish Pattern
By:
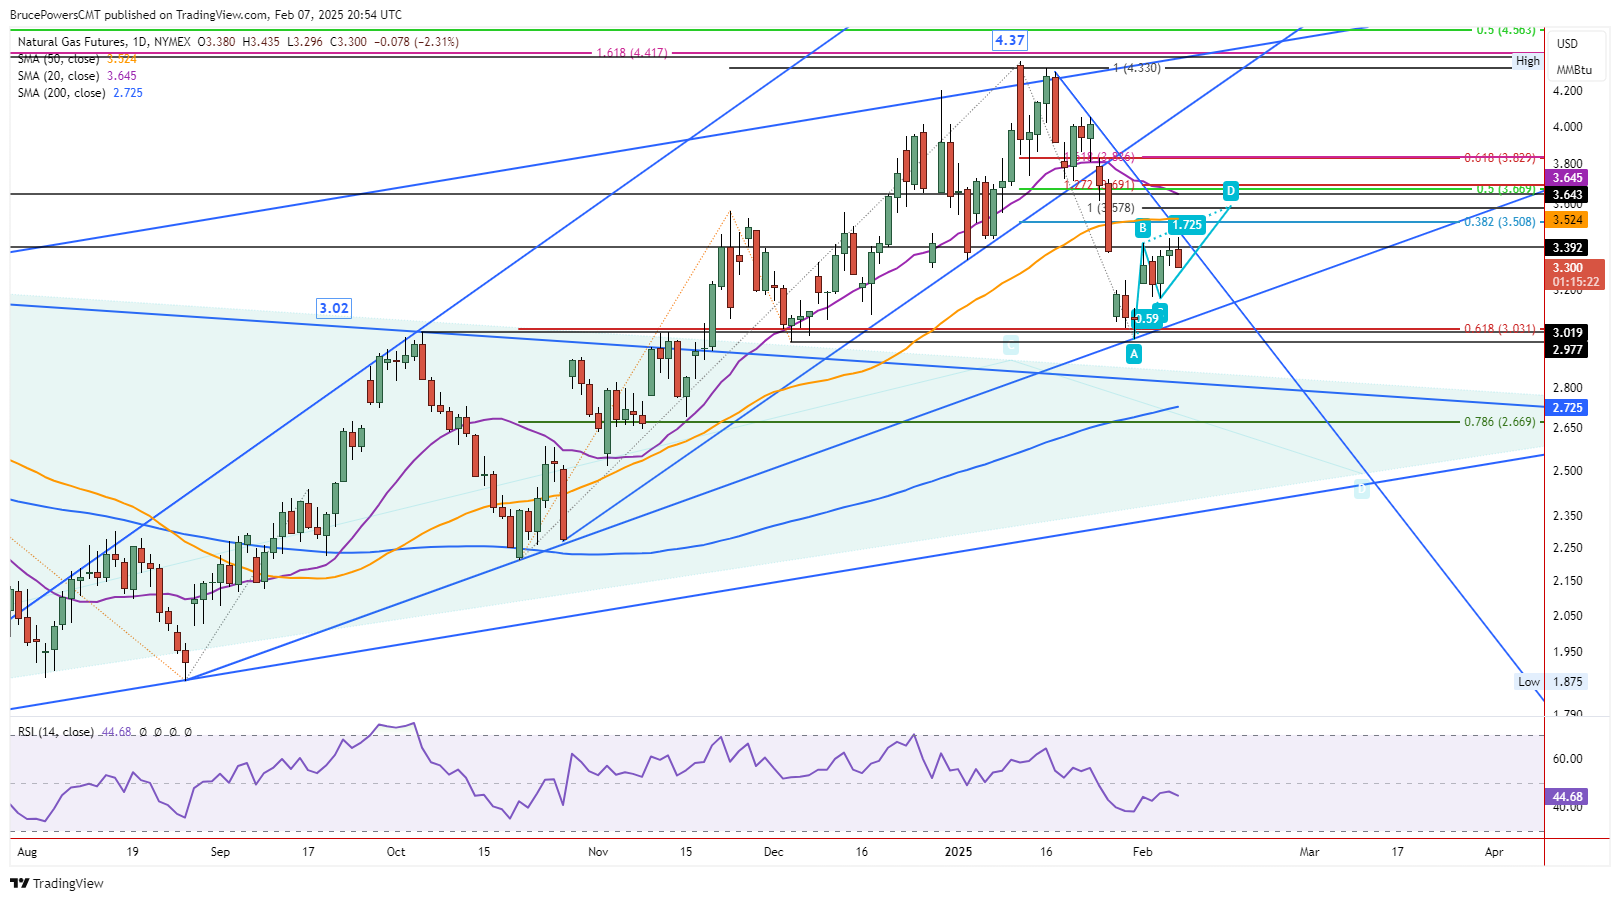
Short-term bearish price action does not negate the bullish rising ABCD pattern targeting $3.58.
Natural gas lost its upward momentum on Friday as it fell below Thursday’s low to a low of $3.30. However, at the time of this writing, natural gas continues to trade near the lows of the day and may reach a lower price before the end of the day and week. It looks likely to close in the lower quarter of the day’s trading range and possibly below yesterday’s low. A close below that low will reflect a very weak closing price, and it opens the door to a bearish continuation heading into next week.
Inside Week Leads to Choppiness
As noted in prior articles, price action in natural gas since the January 31 swing low at $2.99 has been contained within last week’s price range. Last week ended with a wide range red candlestick pattern. Trading inside that range can lead to price behavior like what is seen inside a consolidation range. Choppy price action with unreliable follow-through is common. Therefore, it can be helpful to know what patterns are forming and evolving and the key price levels to pay attention to.
Pattern Integrity Retained
In the near-term, natural gas is in the process of advancing from the $2.99 swing low. Since then, it has formed a small rising ABCD pattern (light blue) as Thursday’s high generated a higher swing high (above B) and therefore a bullish trend continuation signal. Despite today’s bearish performance, if natural gas stays above the interim swing low at $3.16 the price structure of the ABCD pattern remains intact and a continuation higher is anticipated. That expectation would change on a drop below $3.16 as that would violate the integrity of the ABCD pattern of higher swing highs and higher swing lows.
ABCD Pattern Upside Target is $3.58
An initial upside target from the pattern points to $3.58. That is in the middle between two of the major moving averages. The 50-Day MA is at $3.52 and the 20-Day is at 3.65. Each line previously identified trend support, following the upside gap on October 29. During the subsequent advance the 50-Day line did a better job of holding as support until it was broken during the sharp drop on January 28. Therefore, it presents a potentially more significant price area, and it could stop an advance and lead to a bearish reversal. Watch and observe the behavior of natural gas around the 50-Day line, with this possibility in mind.
For a look at all of today’s economic events, check out our economic calendar.
About the Author
Bruce Powerscontributor
Bruce has been involved in the financial markets for over 20 years, as an analyst, trader, educator, and writer.
Latest news and analysis


Advertisement