
Advertisement
Advertisement
Natural Gas rice Forecast: Faces Resistance After 31% Rally
By:
Natural gas hit resistance near $3.75, signaling a potential pullback as bearish patterns emerge despite strong momentum over the past six days.
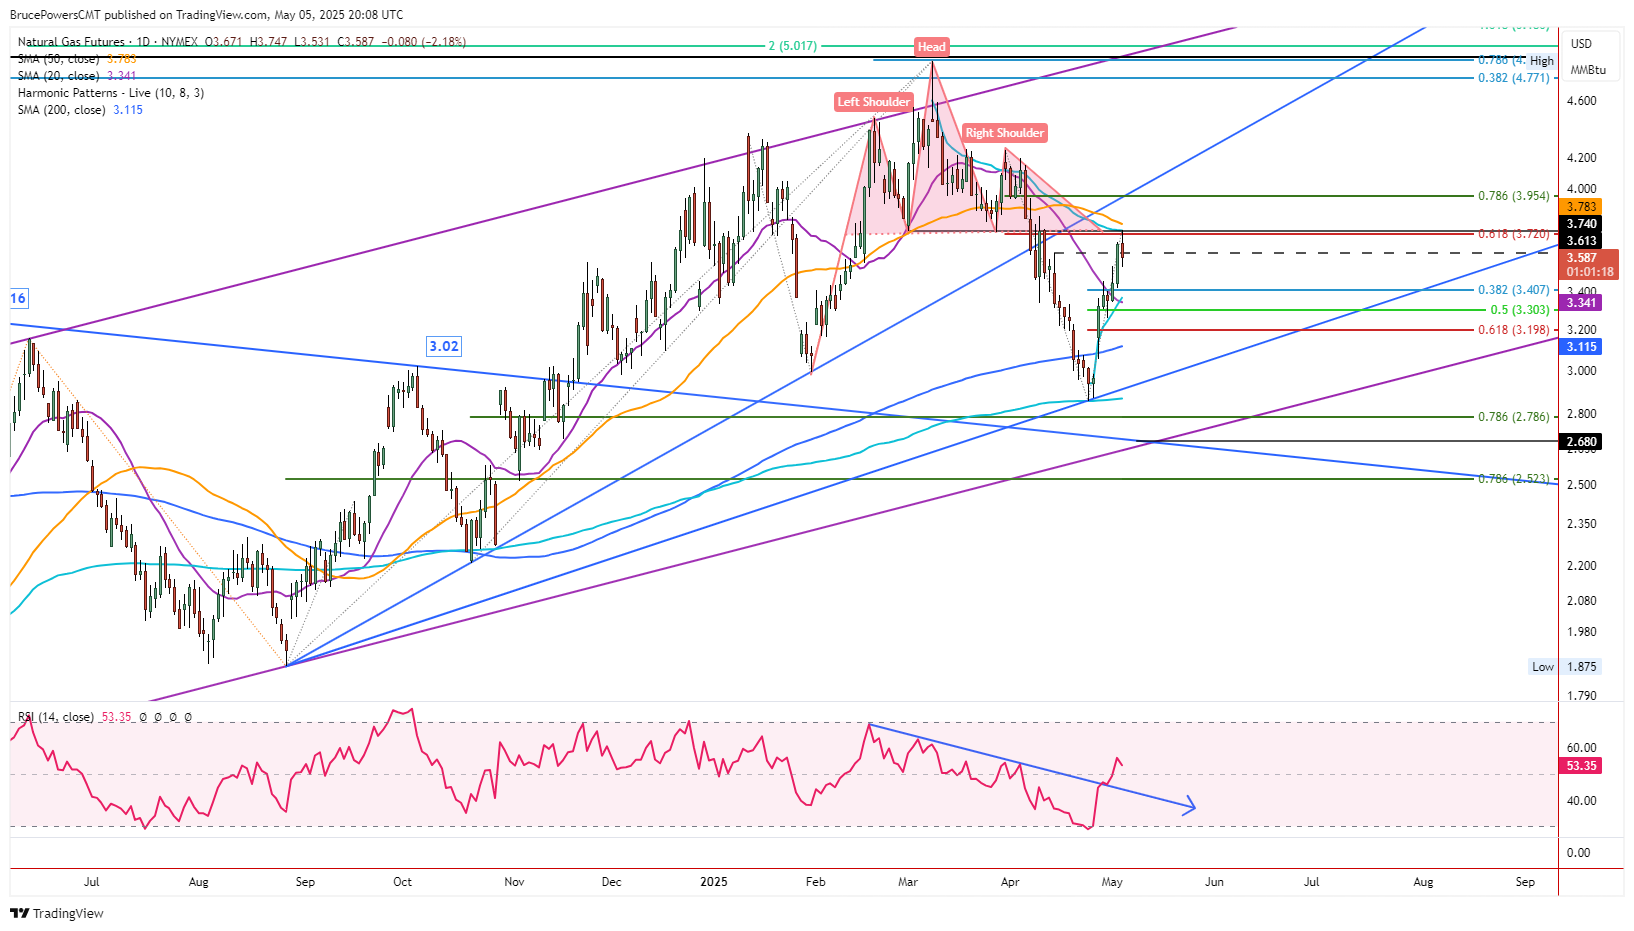
Natural gas rallied to a new high of $3.75 for the counter-trend rally on Monday, before encountering resistance and lower prices. A breakdown from that pattern was triggered in early April. The high for the day was a successful test of resistance at the neckline of a recent head and shoulders top pattern. Also, the resistance area is confirmed by the 61.8% Fibonacci retracement at $3.72 and the AVWAP (light blue) from the recent trend high at $3.74. Together, these indicators identify a potentially significant resistance zone. Judging by the subsequent bearish reaction natural gas looked poised by a deeper pullback.
Bearish Monday
At the time of this writing natural gas continues to trade near the lows of the day and looks likely to close in a similar bearish position. Subsequently, a drop below today’s low will signal a one-day bearish reversal that will likely lead to a pullback to test lower support levels. A key price zone to watch is around the convergence of two indicator lines. Potential support represented by the AVWAP line from the recent low at $3.36 and the 20-Day MA at $3.34. Notice that the typical minimum 38.2% Fibonacci retracement is a little higher at $3.41.
20-Day MA Key Target
The 50% retracement of the recent advance is at $3.30. Since the 20-Day MA continues to trend down it could converge with the 50% level soon. Two or more indicators identifying a similar price area strengthens the potential significance of the zone. Since the 20-Day line was clearly recognized as resistance over two days last week, a pullback to test support around the line should see signs of support if the strength in the counter trend rally is to be sustained.
Rest Healthy for Bull Trend
A bearish pullback prior to an attempt to move higher would be healthy for the price of natural gas. As of the high today, natural gas was up by $0.89 or 31.1% in six days. That is a sign of strength but also an indication that the price of natural gas may be extended and due for pullback. In addition to recent bullish price action, a declining trendline on the relative strength index (RSI) was recently broken thereby confirming bullish momentum. That supports the idea that a pullback should be followed by further signs of strength.
For a look at all of today’s economic events, check out our economic calendar.
About the Author
Bruce Powerscontributor
Bruce has been involved in the financial markets for over 20 years, as an analyst, trader, educator, and writer.


Advertisement