
Advertisement
Advertisement
Natural Gas rice Forecast: Reversal Points to Deeper Pullback Potential
By:
After failing to hold recent highs, natural gas pulled back sharply, raising the likelihood of deeper consolidation or a drop to stronger support areas.
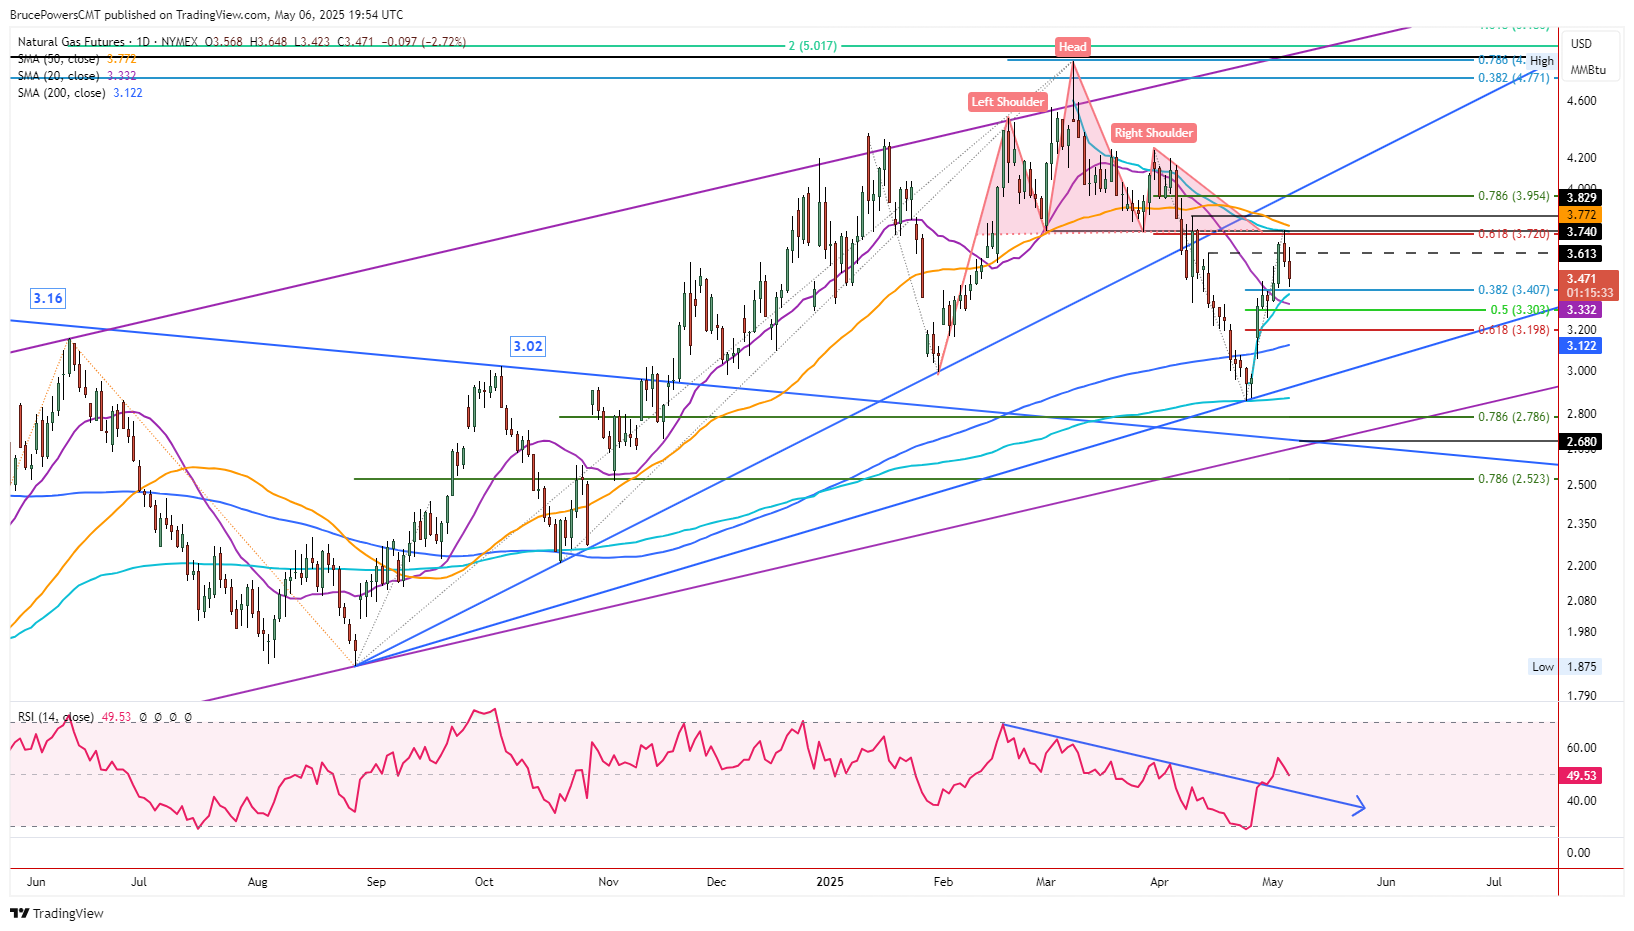
Natural gas triggered a one-day bearish reversal on Tuesday as it fell below Monday’s low of $3.53. A low of $3.42 was hit at the time of this writing, and natural gas looks primed to touch the 38.2% Fibonacci retracement level at $3.41 before the pullback is done, at a minimum. Trading continues to show sellers in charge as activity remains within the lower third of the day’s trading range and natural gas looks likely to close in a similar position.
20-Day Moving Average is Key
The 20-Day MA represents potential support of note as it is a key near-term trending indicator. If natural gas continues to weaken the 20-Day line becomes the next more significant potential support area to watch. The expectation would be for an intraday bullish reversal to set up, following a touch or close to touch of the line. That is the more bullish scenario.
Pullback in Place
It also needs to be considered that the new trend high of $3.75, that was reached yesterday, could lead to a deeper pullback than a few days. Or maybe a period of consolidation. There was solid confluence of the 61.8% Fibonacci retracement, the neckline of a head and shoulders topping pattern, and the AVWAP from the recent trend high, all around the $3.75 high. There may need to be a longer and possibly deeper retracement or consolidation phase for demand to build up in preparation to bust through potential resistance at the $3.75 high.
Reclaim of 50-Day MA Clears the Way
However, there is also the issue of potential resistance around the 50-Day MA, now at $3.77. It is falling and could converge with the $3.75 price area shortly. That would strengthen the significance of both the 50-Day line and $3.75 price area. A daily close above the 50-Day MA is needed for new signs of strength that may sustainable. That is based on moving averages but when looking at price structure, there is a minor interim swing high at $3.83 that offers a good gauge. If that price level is exceeded another bullish reversal signal will be given.
61.8% Retracement at $3.20
Nonetheless, until there is evidence for further strength, natural gas is at risk of a drop below the 20-Day MA. If that occurs the 61.8% Fibonacci retracement level at $3.20 is an area for possible support. There is also the 200-Day MA, now at $3.41.
For a look at all of today’s economic events, check out our economic calendar.
About the Author
Bruce Powerscontributor
Bruce has been involved in the financial markets for over 20 years, as an analyst, trader, educator, and writer.


Advertisement