
Advertisement
Advertisement
Natural Gas, WTI Oil, Brent Oil Forecasts – Oil Pulls Back Amid Signs Of Progress In U.S. – Iran Talks
By:
Key Points:
- Natural gas is under pressure as traders react to the EIA report.
- WTI oil moved lower as Donald Trump said that U.S. was close to a nuclear deal with Iran.
- Brent oil made an attempt to settle below the $63.50 level.

Natural Gas
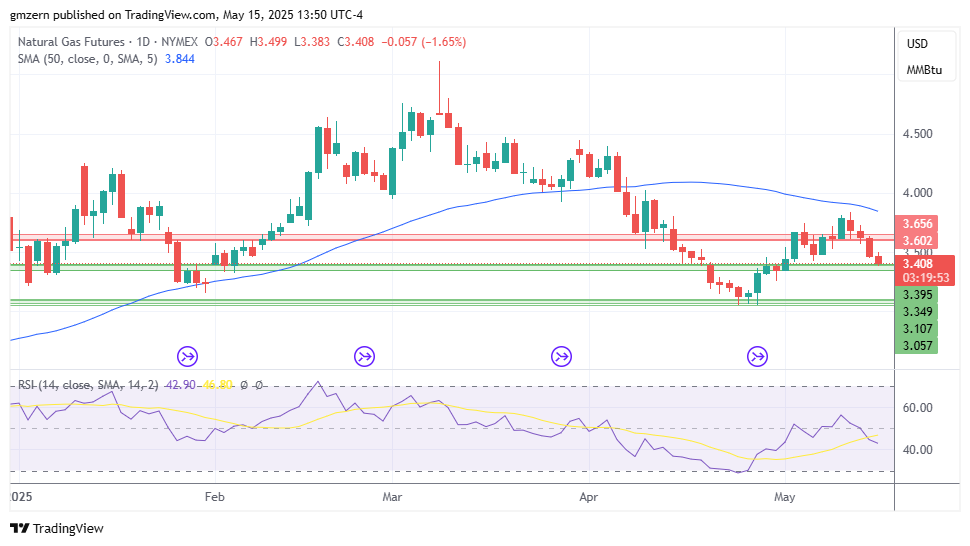
Natural gas tests support at $3.35 – $3.40 as traders react to the EIA report, which indicated that working gas in storage increased by +110 Bcf from the previous week.
In case this test is successful, natural gas will move towards the next support level at $3.05 – $3.10.
WTI Oil
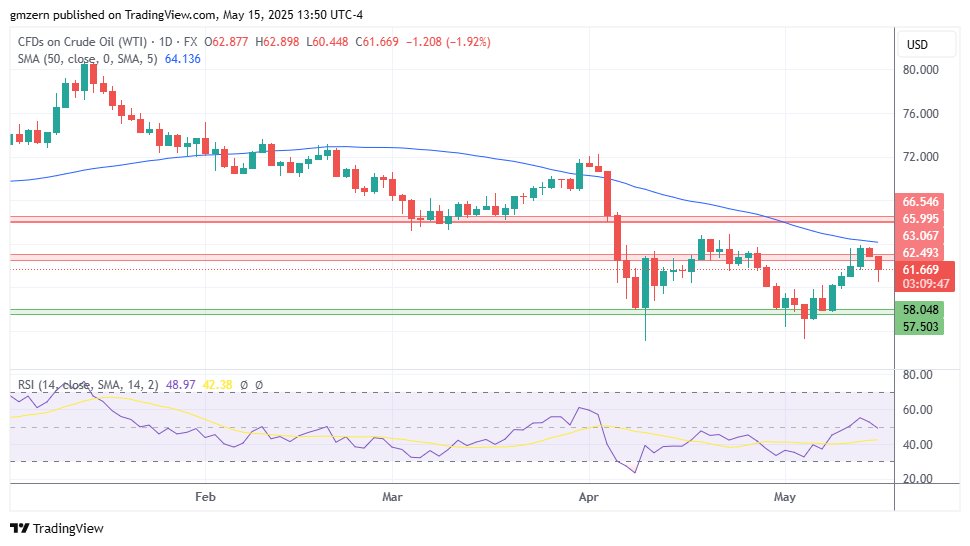
WTI oil pulled back as Donald Trump said that U.S. was close to a nuclear deal with Iran.
If WTI oil pulls back below the $60.00 level, it will move towards the next support level at $57.50 – $58.00.
Brent Oil

Brent oil is losing ground as traders focus on the progress in U.S. – Iran negotiations.
A move below the $63.50 level will open the way to the test of the support at $62.00 – $62.50.
For a look at all of today’s economic events, check out our economic calendar.
About the Author
Vladimir Zernovauthor
In more than 15 years of trading in the financial markets, Vladimir dealt with a wide range of brokers and financial instruments. His career as a day-trader at a proprietary trading firm goes back to 2007. Later, Vladimir turned to longer time frames and became an independent trader and analyst managing his own portfolio. Using his experience, he helps traders find the best broker in his reviews.


Advertisement