
Advertisement
Advertisement
Natural Gas, WTI Oil, Brent Oil Forecasts – Oil Retreats Amid Profit-Taking
By:
Key Points:
- Natural gas traders are bullish ahead of tomorrow's EIA report.
- WTI oil pulled back amid demand worries.
- Brent oil declined below the $61.50 level.

Natural Gas
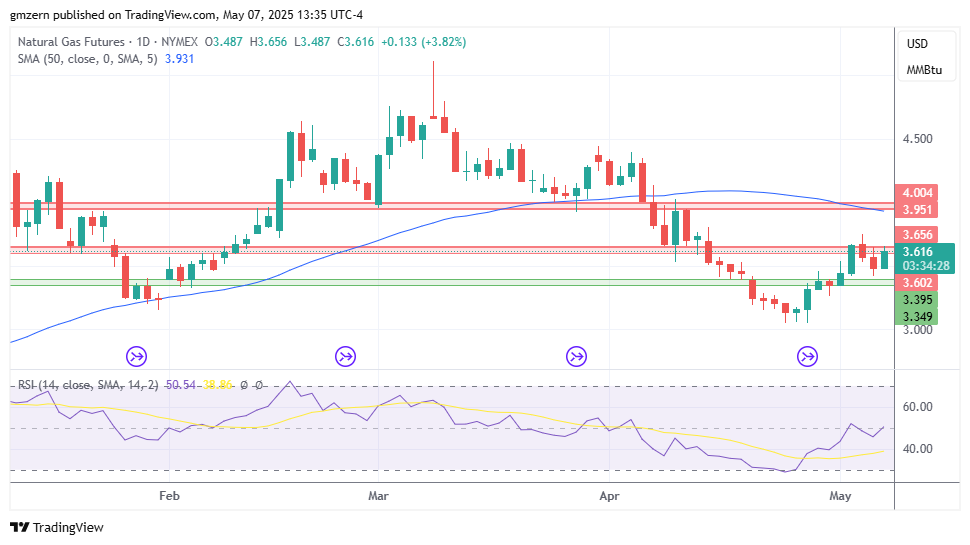
Natural gas rebounds as traders buy the dip despite low demand for natural gas. Traders bet that weather will be hotter in the second half of the month.
A successful test of the resistance at $3.60 – $3.65 will push natural gas towards the next resistance level at $3.95 – $4.00.
WTI Oil

WTI oil pulled back as traders remained worried about the negative impact of trade wars.
If WTI oil settles back below the support at $57.50 – $58.00, it will head towards the next support level, which is located in the $53.50 – $54.00 range.
Brent Oil
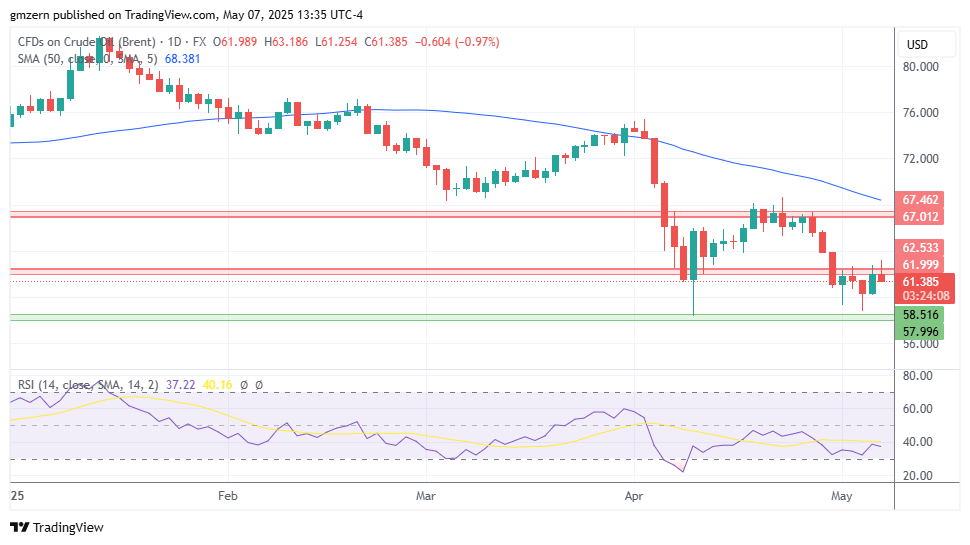
Brent oil made an attempt to settle above the resistance at $62.00 – $62.50, but lost momentum and pulled back.
If Brent oil declines below the $60.00 level, it will move towards the support level at $58.00 – $58.50.
For a look at all of today’s economic events, check out our economic calendar.
About the Author
Vladimir Zernovauthor
In more than 15 years of trading in the financial markets, Vladimir dealt with a wide range of brokers and financial instruments. His career as a day-trader at a proprietary trading firm goes back to 2007. Later, Vladimir turned to longer time frames and became an independent trader and analyst managing his own portfolio. Using his experience, he helps traders find the best broker in his reviews.


Advertisement